Thats interesting. What else can it do? How well can summary - - PowerPoint PPT Presentation

that s interesting what else can it do
SMART_READER_LITE
LIVE PREVIEW

Thats interesting. What else can it do? How well can summary - - PowerPoint PPT Presentation

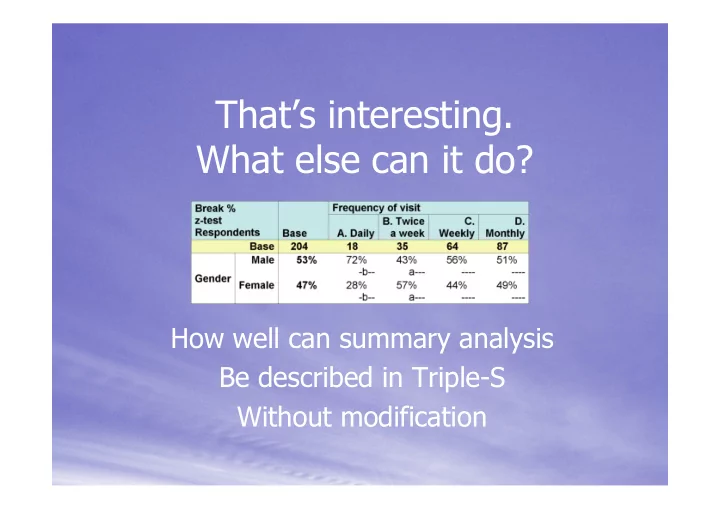
Thats interesting. What else can it do? How well can summary analysis Be described in Triple-S Without modification Aim Summary analysis data Unmodified Triple-S Business data Not presentation and formatting Use in


slide-1
SLIDE 1

That’s interesting. What else can it do?

How well can summary analysis Be described in Triple-S Without modification

slide-2
SLIDE 2

Aim

  • Summary analysis data
  • Unmodified Triple-S
  • Business data
  • Not presentation and formatting
  • Use in further data analysis
  • Use by display formatters
slide-3
SLIDE 3

Requirements

Tabular data:

  • Frequency
  • Crosstab
  • Descriptive statistics
  • Grid and holecount

Graphical data:

  • Same as tabular data
slide-4
SLIDE 4

Requirements

Cell contents:

  • Counts
  • Percentages
  • Totals
  • Means of other variables
  • Other statistical formulae
  • Non-numeric results
slide-5
SLIDE 5

Solution – Simple frequency

  • A new Triple-S survey
  • Once case per cell
  • Variables for each level of each axis
  • Variables for

each cell value

  • Text mode for
  • riginal context

Analysis title Analysis label Counts Total percent

slide-6
SLIDE 6

Solution – Simple frequency

Analysis title Analysis label Counts Total percent

slide-7
SLIDE 7

Solution – Crosstabs and others

  • Extend frequency table definition
  • Convert 2D table data to 1D case data
  • Still one case per cell
  • One variable per cell value
  • Percentages and non-numeric values
  • Descriptive statistics
  • Grids and holecounts
slide-8
SLIDE 8

Solution – Crosstabs and others

Analysis title Analysis label Z test Break percent Break title Break label

slide-9
SLIDE 9

Acceptance criteria

Test with Xslt

slide-10
SLIDE 10

Acceptance criteria

Servlets

  • Xslt transformer
  • Triple-S file provider
  • List of available surveys
slide-11
SLIDE 11

Demonstration

slide-12
SLIDE 12

Areas for improvement

  • Single file
  • Meaning and level of labels
  • Titles, notes and annotations
  • Drill-down
slide-13
SLIDE 13

Any Questions?