TH THE PE PERF RFORMANC ORMANCE IM IMPERATIVE A FRAMEWORK FOR - - PowerPoint PPT Presentation

th the pe perf rformanc ormance im imperative
SMART_READER_LITE
LIVE PREVIEW

TH THE PE PERF RFORMANC ORMANCE IM IMPERATIVE A FRAMEWORK FOR - - PowerPoint PPT Presentation

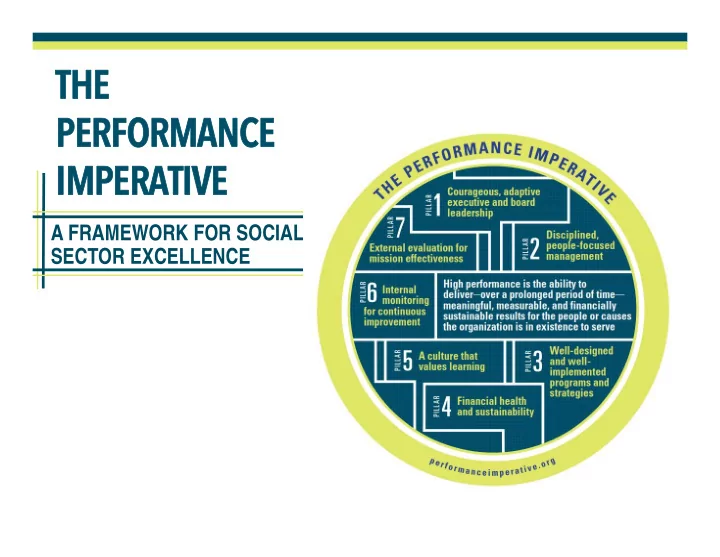
TH THE PE PERF RFORMANC ORMANCE IM IMPERATIVE A FRAMEWORK FOR SOCIAL- SECTOR EXCELLENCE LEADERS & MANAGERS: Are cl clear on ear on the tar the target pop et popula lati tion or audience they serve on or audience they serve and


slide-1
SLIDE 1

A FRAMEWORK FOR SOCIAL- SECTOR EXCELLENCE

TH THE PE PERF RFORMANC ORMANCE IM IMPERATIVE

slide-2
SLIDE 2

LEADERS & MANAGERS:

  • Are cl

clear on ear on the tar the target pop et popula lati tion or audience they serve

  • n or audience they serve and are passionate about

serving them.

  • Base the

Base the desig design of

  • f thei

their pr r prog

  • gra

rams and stra and strategi tegies on a s es on a sound anal und analysis of ysis of t the i he issues, ssues, insig nsights fr ts from

  • m i

intended beneficia tended beneficiaries, ies, and evidence i and evidence infor formed assum ed assumptions tions about how the organization’s activities can lead to the desired change (often referred to as a “theory of change”).

  • Desig

Design pr prog

  • gra

rams wi with car th careful attention ful attention to the l to the larger ecosystem er ecosystem i in whi which they h they

  • pera
  • perate, including racial, cultural, geographic, historical, and political dynamics.
slide-3
SLIDE 3
slide-4
SLIDE 4
slide-5
SLIDE 5
slide-6
SLIDE 6
slide-7
SLIDE 7
slide-8
SLIDE 8
slide-9
SLIDE 9
slide-10
SLIDE 10
slide-11
SLIDE 11
slide-12
SLIDE 12
slide-13
SLIDE 13
slide-14
SLIDE 14
slide-15
SLIDE 15
slide-16
SLIDE 16
slide-17
SLIDE 17
slide-18
SLIDE 18
slide-19
SLIDE 19
slide-20
SLIDE 20
slide-21
SLIDE 21

2019= 29,104,064 estimate

slide-22
SLIDE 22

Texas w on the 2 0 1 0 Census!

slide-23
SLIDE 23
  • From 2000 to 2005:
  • 11 “metro” counties experienced growth of 20% or more
  • 93 non-metro counties had declining populations
slide-24
SLIDE 24

Texas Urban Triangle

slide-25
SLIDE 25

Texas Urban Triangle ( at night)

slide-26
SLIDE 26

Texas Urban Triangle ( at night)

W aco

Dallas Houston San Antonio

slide-27
SLIDE 27

Texas Urban Triangle ( at night)

W aco

slide-28
SLIDE 28
slide-29
SLIDE 29

City of W aco

slide-30
SLIDE 30

Projected Growth

slide-31
SLIDE 31
slide-32
SLIDE 32
slide-33
SLIDE 33
slide-34
SLIDE 34
slide-35
SLIDE 35
slide-36
SLIDE 36
slide-37
SLIDE 37
slide-38
SLIDE 38
slide-39
SLIDE 39
slide-40
SLIDE 40
slide-41
SLIDE 41
slide-42
SLIDE 42
slide-43
SLIDE 43
slide-44
SLIDE 44
slide-45
SLIDE 45
slide-46
SLIDE 46
slide-47
SLIDE 47
slide-48
SLIDE 48
slide-49
SLIDE 49
slide-50
SLIDE 50