tf tf iic 0 1
play

= + TF TF IIC 0 . 1 (4) m The IIC can be qualified as a - PDF document

MOL2NET, 2018 , 4, http://sciforum.net/conference/mol2net-04 1 MOL2NET, International Conference Series on Multidisciplinary Sciences MDPI Idealized correlations: prediction of solubility of fullerene in organic solvents Alla P. Toropova * ,


  1. MOL2NET, 2018 , 4, http://sciforum.net/conference/mol2net-04 1 MOL2NET, International Conference Series on Multidisciplinary Sciences MDPI Idealized correlations: prediction of solubility of fullerene in organic solvents Alla P. Toropova * , Andrey A. Toropov, Emilio Benfenati 
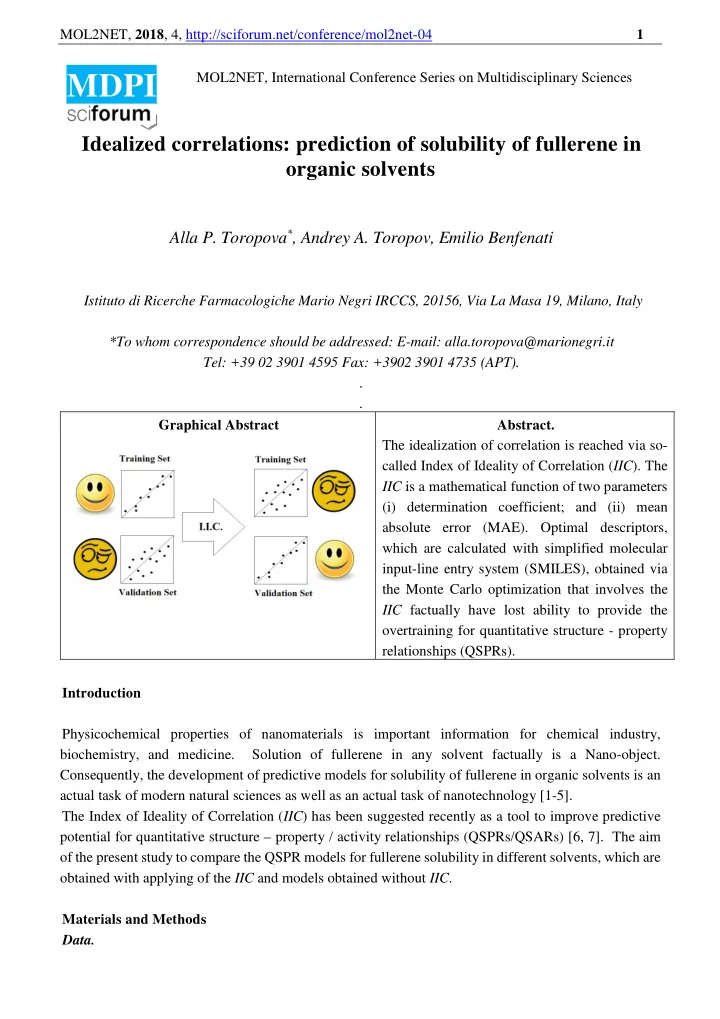
Istituto di Ricerche Farmacologiche Mario Negri IRCCS, 20156, Via La Masa 19, Milano, Italy *To whom correspondence should be addressed: E-mail: alla.toropova@marionegri.it Tel: +39 02 3901 4595 Fax: +3902 3901 4735 (APT). . . Graphical Abstract Abstract. The idealization of correlation is reached via so- called Index of Ideality of Correlation ( IIC ). The IIC is a mathematical function of two parameters (i) determination coefficient; and (ii) mean absolute error (MAE). Optimal descriptors, which are calculated with simplified molecular input-line entry system (SMILES), obtained via the Monte Carlo optimization that involves the IIC factually have lost ability to provide the overtraining for quantitative structure - property relationships (QSPRs). Introduction Physicochemical properties of nanomaterials is important information for chemical industry, biochemistry, and medicine. Solution of fullerene in any solvent factually is a Nano-object. Consequently, the development of predictive models for solubility of fullerene in organic solvents is an actual task of modern natural sciences as well as an actual task of nanotechnology [1-5]. The Index of Ideality of Correlation ( IIC ) has been suggested recently as a tool to improve predictive potential for quantitative structure – property / activity relationships (QSPRs/QSARs) [6, 7]. The aim of the present study to compare the QSPR models for fullerene solubility in different solvents, which are obtained with applying of the IIC and models obtained without IIC . Materials and Methods Data.

  2. MOL2NET, 2018 , 4, http://sciforum.net/conference/mol2net-04 2 The experimental data on the fullerene solubility (logS) are taken in the literature [8]. Four solvents have undefined values (logS<-8). These solvents were removed from consideration, consequently 128 solvents are examined here. The total data (n=128) were randomly split into the training, invisible training, calibration, and validation sets. Each set has special task: 1. The training set is ‘builder’ of the model. Compounds from this set are basis to obtain the correlation weights, which give maximal value of target function; 2. The invisible training set is inspector’ of the model. Compounds of this set are basis to check up: whether the model is satisfactory for substances, which are not involved into the Monte Carlo optimization; 3. The calibration set is ‘estimator’ of the model; and the task of this set is to detect start of the overtraining; and 4. Finally, there is the validation set: these substances are the basis of final checking up of the predictive potential of the model. Optimal descriptor The optimal descriptor is a mathematical function of simplified molecular input line-entry system (SMILES) [10]. The SMILES contains a group of SMILES-atom. The SMILES-atom can be one character or two characters, which cannot be examined separately (e.g. ‘Cl’, ‘Br’, etc.). �� ���� ����� ∗ , � ∗ � = � ��� � � � + � ��� �� � � (1) ��� ��� The descriptor is calculated with so-called correlation weights, i.e. coefficients which calculated by the Monte Carlo method by algorithm described below. The Sk is the SMILES-atom. The SSk is a pair of SMILES atoms which are neighbors in the SMILES notation. The NA is the number of SMILES-atoms for a given SMILES [9]. The Sk and SSk are SMILES attributes. The Monte Carlo method gives model that is one variable correlation: ���������� �60 = � � + � � × ����� ∗ , � ∗ � (2) The CW( S k ) and CW( SS k ) are the above-mentioned correlation weights for the above-mentioned SMILES-attributes. The correlation weights are special coefficient calculated with the Monte Carlo method. The numerical data on the correlation weights should provide maximal value of a target function ( TF ) calculated as the following: = + − + × TF R R R R 0 . 1 (3) − − training invisible training training invisible training Recently, the modified target function that improves QSPR/QSAR models based on the traditional correlation has been suggested. The Index of Ideality of Correlation ( IIC ) [9] is additional component of the function: = + × TF TF IIC 0 . 1 (4) m The IIC can be qualified as a criterion to estimate statistical quality of a model. The scheme to calculate IIC is the following. = − delta observed calculated (5) k k k The observed k and calculated k are values of an endpoint. Having data on all delta k for the calibration set, one can calculate sum of negative and positive values of delta k similar to mean absolute error (MAE):

  3. MOL2NET, 2018 , 4, http://sciforum.net/conference/mol2net-04 3 − N 1  − = − < < MAE delta , N delta 0 delta 0 is the number of (6) − calibratio n k k k N = k 1 + N 1  + = + ≥ ≥ MAE delta , N delta 0 delta 0 is the number of (7) + calibratio n k k k N = k 1 − + min( MAE , MAE ) = × calibratio n calibratio n IIC r − + calibratio n max( MAE , MAE ) calibratio n calibratio n (8) The IIC can be calculated for training, invisible training, and validation sets, but the key role for the index is improving of the predictive potential of a model is related to the calibration set. The T is threshold to discriminate SMILES-atoms into two classes (i) rare, which is noise and should be removed from building up a model; and (ii) not rare, which are basis to build up the model. The N is the number of epochs of the Monte Carlo optimization. The T=T* and N=N* are values of the parameters which gives the best results for the calibration set. Results and Discussion Table 1 contains statistical quality of models for fullerene solubility build up with target function TF calculated with Eq. 3 and TFm calculated with Eq. 4. Factually, data from Table 1 confirms that the IIC improves the predictive potential of the model for fullerene solubility. The similar situation was described for models of mutagenicity [6] and for models of skin permeability [7]. The statistical quality of prediction for the model of solubility of fullerene in organic solvents that is suggested in the literature [8] is the following: n=28, r 2 =0.804, RMSE=0.386. In other words, models (obtained with applying the IIC ) represented in Table 1 have comparable, or even better, predictive potential. [Table 1 around here] Conclusions The applying of the IIC as addition component of the target function for the Monte Carlo optimization is considerable improves the predictive potential of the model based on the optimal SMILES-based descriptors calculated with the CORAL software (http://www.insilico.eu/coral). Acknowledgments Authors thank the project LIFE-CONCERT contract (LIFE17 GIE/IT/000461) for financially supported. References 1. Barzegar, A.; Jafari Mousavi, S.; Hamidi, H.; Sadeghi, M. 2D-QSAR study of fullerene nanostructure derivatives as potent HIV-1 protease inhibitors. Physica E: Low-Dimens. Syst. Nanostruct. 2017 , 93 , 324-331.

  4. MOL2NET, 2018 , 4, http://sciforum.net/conference/mol2net-04 4 2. Hassanzadeh, Z.; Ghavami, R.; Kompany-Zareh, M. Radial basis function neural networks based on the projection pursuit and principal component analysis approaches: QSAR analysis of fullerene [C60]- based HIV-1 PR inhibitors. Med. Chem. Res. 2016 , 25 (1) , 19-29. 3. Kleandrova, V.V.; Luan, F.; Speck-Planche, A.; Cordeiro, M.N.D.S. In silico assessment of the acute toxicity of chemicals: Recent advances and new model for multitasking prediction of toxic effect. Mini- Rev. Med. Chem. 2015 , 15 (8) , 677-686. 4. Singh, K.P.; Gupta, S. Nano-QSAR modeling for predicting biological activity of diverse nanomaterials. RSC Advanc. 2014 , 4 (26) , 13215-13230. 5. Ghasemi, J.B.; Salahinejad, M.; Rofouei, M.K. Alignment independent 3D-QSAR modeling of fullerene (C 60) solubility in different organic solvents. Fuller. Nanotub. Car. N. 2013 , 21 (5) , 367-380. 6. Toropov, A.A.; Toropova, A.P. The index of ideality of correlation: A criterion of predictive potential of QSPR/QSAR models? Mutat. Res-Gen. Tox. En. 2017 , 819 , 31-37. 7. Toropova, A.P.; Toropov, A.A. The index of ideality of correlation: A criterion of predictability of QSAR models for skin permeability? Sci. Tot. Environ. 2017 586 , 466-472. 8. Ghasemi, J.B.; Salahinejad, M.; Rofouei, M.K. Alignment independent 3D-QSAR modeling of fullerene (C 60) solubility in different organic solvents. Fuller. Nanotub. Car. N. 2013 , 21 (5) , 367-380. 9. Toropov, A.A.; Toropova, A.P.; Benfenati, E.; Salmona, M. Mutagenicity, anticancer activity and blood brain barrier: similarity and dissimilarity of molecular alerts. Toxicol. Mech. Method . 2018 , 28 (5) , 321-327. 10. Weininger, D. SMILES a chemical language and information system. 1. Introduction to methodology and encoding rules. J. Chem. Inf. Comput. Sci. 1988 , 28 , 31-36.

Download Presentation
Download Policy: The content available on the website is offered to you 'AS IS' for your personal information and use only. It cannot be commercialized, licensed, or distributed on other websites without prior consent from the author. To download a presentation, simply click this link. If you encounter any difficulties during the download process, it's possible that the publisher has removed the file from their server.

Recommend


More recommend