
SLIDE 1
1
1
Text Categorization
CSE 454
2
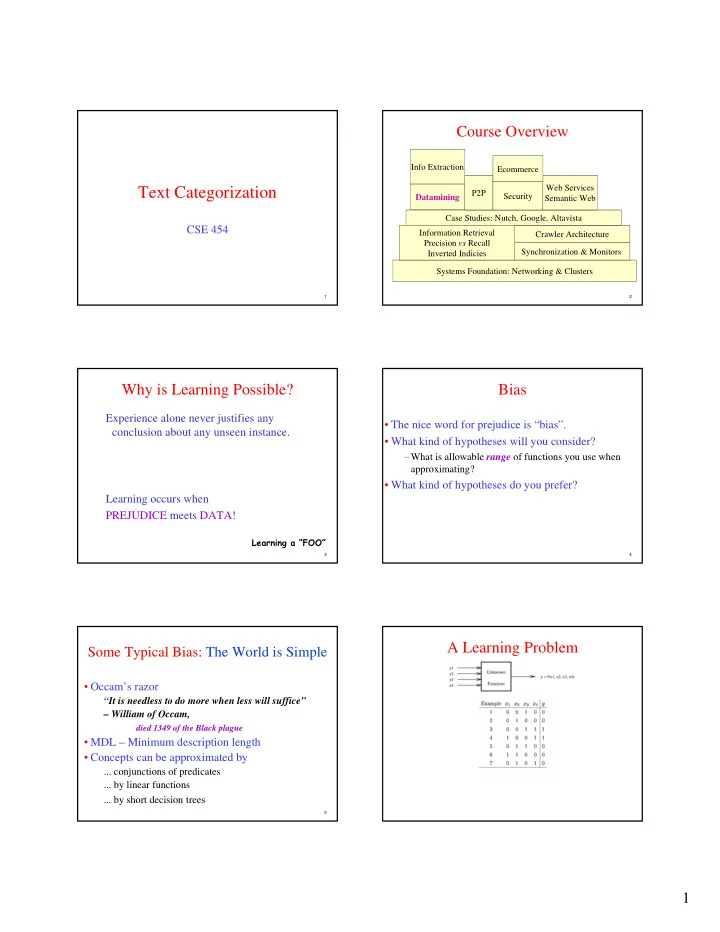
Course Overview
Systems Foundation: Networking & Clusters Datamining Synchronization & Monitors Crawler Architecture Case Studies: Nutch, Google, Altavista Information Retrieval Precision vs Recall Inverted Indicies P2P Security Web Services Semantic Web Info Extraction Ecommerce
3
Why is Learning Possible?
Experience alone never justifies any conclusion about any unseen instance. Learning occurs when PREJUDICE meets DATA!
Learning a “FOO”
4
Bias
- The nice word for prejudice is “bias”.
- What kind of hypotheses will you consider?
–What is allowable range of functions you use when approximating?
- What kind of hypotheses do you prefer?
5
Some Typical Bias: The World is Simple
- Occam’s razor
“It is needless to do more when less will suffice” – William of Occam,
died 1349 of the Black plague
- MDL – Minimum description length
- Concepts can be approximated by
... conjunctions of predicates ... by linear functions ... by short decision trees
6