SLIDE 1
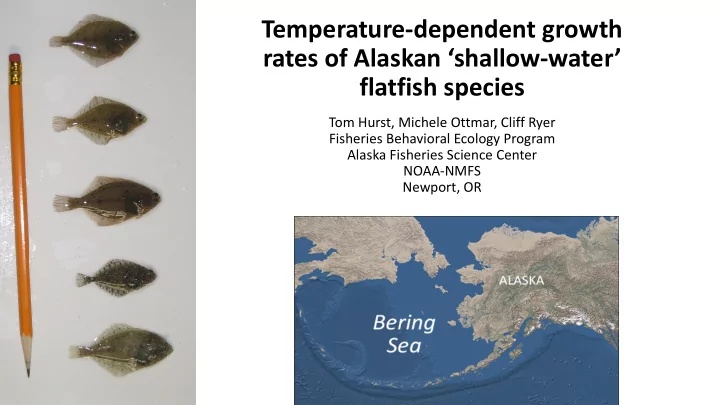
Temperature-dependent growth rates of Alaskan ‘shallow-water’ flatfish species
Tom Hurst, Michele Ottmar, Cliff Ryer Fisheries Behavioral Ecology Program Alaska Fisheries Science Center NOAA-NMFS Newport, OR
SLIDE 2 Fl Flatfi fishes in Al Alaska
- 24 Species recorded in Alaskan waters
- ~ 15 species common in Gulf of Alaska and/or Bering Sea
- 14 species commercially harvested
- 2011 – 2015 average
> 250,000 MT/y ~ $225 M/y
Yellowfin sole – largest landings of any flatfish in world Rock sole (northern + southern) – second largest landings Pacific halibut – most valuable – over $130 M/y commercial + important recreational + subsistence fisheries
Compiled from: Mecklenburg et al. 2002. Fishes of Alaska NOAA Commercial fishery statistics website NMFS 2014. Fisheries economics of the United States
SLIDE 3
Spe Specie ies dis distribut ibutio ions ns – “s “shallow water complex”
Northern rock sole Yellowfin sole Pacific halibut Alaska plaice English sole Longhead dab Adult distributions from Matarese et al. 2003 LHD distribution from Mecklenburg et al. 2002 All six species reside in shallow coastal nurseries as juveniles.
SLIDE 4
Te Temperature-de depe pende ndent growth h rates.
Temperature-dependent growth rates of juveniles measured by Ryer, Hurst, & Boersma. 2012
Northern rock sole Pacific halibut English sole
SLIDE 5
Objectives:
Measure temperature-dependent growth rates of Yellowfin sole Alaska plaice Longhead dab Compare thermal responses among 6 Alaskan flatfishes Contrast yellowfin sole and northern rock sole thermal sensitivity, habitat, distribution, and climate responses.
SLIDE 6 Fi Fish collections
Collection locations: YFS: Kodiak, AK AKP: Nome, AK LHD: Nome, AK NRS: Kodiak, AK PH: Kodiak, AK ES: Newport, OR Fish collected from nearshore waters 3-20 m depth Otter trawl & beam trawl Held for several days at collection site Overnight shipment to AFSC laboratory
- n campus of OSU in Newport, OR
SLIDE 7
Ex Expe perim imental al fac acilit ilitie ies
Because of logistical constraints associated with fish numbers and quarantine requirements for some species, we had to do experiments in two different sets of tanks. “large” round tanks, n=15 Used for: NRS, PH, ES, LHD Used for: YFS, AKP, PH Crossover: LHD measured in tanks used for earlier studies Additional PH expt in small tanks at 9°C “small” rectangle tanks, n=32
SLIDE 8
Ex Expe perim imental al pr protocols ls
Tank mean growth rates used in all analyses Number of independent tanks = 10-16 per species Fish acclimated to laboratory culture for at least 2 months prior use in experiments. Extended low temperature range to 2°C for AKP, YFS, LHD. Fish acclimated to test temperatures at approx. 1.5°C / day Acclimated for 2 weeks prior to measuring growth rates. Fish fed ad libitum once per day; “gel food” Measured 3-5 times at 2 week intervals Individual fish identified through size-rank differences except YFS & Supplemental PH experiment; RFID PIT tags in body cavity Analyses based on tank mean growth rates
SLIDE 9
Gr Growth and survival
High survival to temperatures where growth drops off. Alaska plaice
SLIDE 10
Gr Growth and survival
High survival to temperatures where growth drops off. Survival declined above temperature of maximum growth. Alaska plaice Yellowfin sole
SLIDE 11
Gr Growth and survival
High survival to temperatures where growth drops off. Survival declined above temperature of maximum growth. Low survival at temperatures above 10°C, but surviving fish had high growth. *Not size-dependent. Alaska plaice Yellowfin sole Longhead dab
SLIDE 12
Co Comparison growth rates patterns across studies
Ryer et al. 2012.
See generally similar patterns. Extended experiments to lower temperatures. Stronger effects observed at the highest temeratures.
SLIDE 13
Co Comparison growth rates patterns across studies???
Are there methodological differences that can explain the lower rates observed in the current study. But overall slower growth observed in AKP, YFS, LHD than NRS, PH, ES
SLIDE 14 Ha Halibut e t exp xper erimen ent c t com
son
An experiment on juvenile halibut conducted in 2016, at the same time as the YFS experiment allowed us to evaluate the potential for procedural differences between experiments.
Ryer et al. 2012 tested 5, 9, 13, 16° “large” round tanks 7 fish per tank not tagged mean 69.5 mm TL Hurst and Planas, unpublished* tested 2 and 9°C “small” tanks 5 fish per tank internal RFID tags mean 66.7 mm TL < 10% difference in SGR
Growth at 9°C
*Talk by Planas and Hurst, Tuesday 11am.
SLIDE 15 Siz Size effects?
LHD 16° AKP 13° YFS 13° PH 16° ES 16° NRS 13°
Not enough size variation within each experiment to describe size-dependent variation in growth. But, likely not enough to be responsible for the observed differences in measured rates.
SLIDE 16 Siz Size effects? Ag Age ef effects?
Age 0 Age 1 But, because of differences in the timing of spawning and settlement: NRS, PH, ES were collected as age-0 AKP, YFS, and YFS were collected as age-1 Is there an age effect on growth potential, independent of the general decline in SGR with increasing size. H0: age-0 (pre-first winter) fish are “different” than age-1 (post-first winter)?
LHD 16° AKP 13° YFS 13° PH 16° ES 16° NRS 13°
Similar patterns observed among juvenile gadids.
Laurel et al. 2016
SLIDE 17
Co Comparing temperature sensitivity y among species
Calculate temperature of maximum SGR Calculate temperature range to 50% SGR Delta T Eurythermic Stenothermic LHD Representative? High mortality at these temps.
SLIDE 18 Im Implicati tion
s for
climate c e change
The “Blob” – extensive area of warm waters
- ver the N. Pacific & Bering Sea
Yellowfin sole may be most sensitive to climate change because of their high thermal sensitivity. Already have field evidence of sensitivity.
SLIDE 19
In Inter erannual va variation in growth reflects thermal sensitivity
Matta et al. 2010. MEPS. Collected NRS, AKP, and YFS from Bering Sea where the species distrubutions overlap. Look at synchrony and climate drivers of annual growth rates. Otolith ring width index based on within individual, across year variation.
SLIDE 20
In Inter erannual va variation in growth reflects thermal sensitivity
Eurythermic Stenothermic
SLIDE 21
Eurythermic Stenothermic What about other parts of the distribution?
SLIDE 22
Yellowfin sole Northern rock sole
No Northernmost range
General models would predict that warming would allow northern rock sole to expand farther north, occupying waters currently inhabited by YFS and AKP. But, coastal temperatures do not follow latitudinal trends. Warming may reduce habitat suitability for the high latitude species even in the northern part of their range.
X
SLIDE 23 Sum Summar ary
Differences among species in thermal sensitivity. YFS have high thermal sensitivity and live in the most thermally variable environments. Growth responses did not match survival patterns in LHD. YFS will be more sensitive to climate changes. Climate change may alter habitat use throughout their range. Future:
- 1. Repeat experiments across ages to clarify size and age effects.
- 2. Perform temperature preference experiments
– link performance to preference.
- 3. Spatially explicit model of seasonal growth potential.
Broader: Explore how to integrate field and laboratory studies to improve understanding of climate and habitat interactions on fish distributions and productivity.