
SLIDE 1
rates of Alaskan shallow - water flatfish species Tom Hurst, - - PowerPoint PPT Presentation
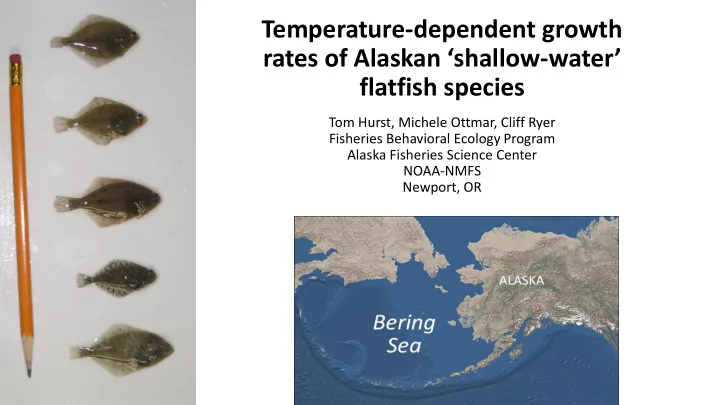
Temperature-dependent growth rates of Alaskan shallow - water flatfish species Tom Hurst, Michele Ottmar, Cliff Ryer Fisheries Behavioral Ecology Program Alaska Fisheries Science Center NOAA-NMFS Newport, OR Fla latfi fishes in in
Compiled from: Mecklenburg et al. 2002. Fishes of Alaska NOAA Commercial fishery statistics website NMFS 2014. Fisheries economics of the United States
Northern rock sole Yellowfin sole Pacific halibut Alaska plaice English sole Longhead dab Adult distributions from Matarese et al. 2003 LHD distribution from Mecklenburg et al. 2002 All six species reside in shallow coastal nurseries as juveniles.
Northern rock sole Pacific halibut English sole
Temperature
5 9 13 16
Specific growth rate
0.00 0.01 0.02 0.03
NRS PH ES
Collection locations: YFS: Kodiak, AK AKP: Nome, AK LHD: Nome, AK NRS: Kodiak, AK PH: Kodiak, AK ES: Newport, OR Fish collected from nearshore waters 3-20 m depth Otter trawl & beam trawl Held for several days at collection site Overnight shipment to AFSC laboratory
Because of logistical constraints associated with fish numbers and quarantine requirements for some species, we had to do experiments in two different sets of tanks. “large” round tanks, n=15 Used for: NRS, PH, ES, LHD Used for: YFS, AKP, PH Crossover: LHD measured in tanks used for earlier studies Additional PH expt in small tanks at 9°C “small” rectangle tanks, n=32
Tank mean growth rates used in all analyses Number of independent tanks = 10-16 per species Fish acclimated to laboratory culture for at least 2 months prior use in experiments. Extended low temperature range to 2°C for AKP, YFS, LHD. Fish acclimated to test temperatures at approx. 1.5°C / day Acclimated for 2 weeks prior to measuring growth rates. Fish fed ad libitum once per day; “gel food” Measured 3-5 times at 2 week intervals Individual fish identified through size-rank differences except YFS & Supplemental PH experiment; RFID PIT tags in body cavity Analyses based on tank mean growth rates
Temperature (°C)
2 5 9 13 16
Specific growth rate
0.000 0.005 0.010 0.015
Survival % 20 40 60 80 100 Temperature (°C)
2 5 9 13 16
Specific growth rate
0.000 0.005 0.010 0.015
Survival % 20 40 60 80 100 Temperature (°C)
2 5 9 13 16
Specific growth rate
0.000 0.005 0.010 0.015
Survival % 20 40 60 80 100
High survival to temperatures where growth drops off. Survival declined above temperature of maximum growth. Low survival at temperatures above 10°C, but surviving fish had high growth. *Not size-dependent. Alaska plaice Yellowfin sole Longhead dab
Temperature
5 9 13 16
Specific growth rate
0.00 0.01 0.02 0.03
NRS PH ES
Temperature
2 4 6 8 10 12 14 16
Specific growth rate
0.000 0.005 0.010 0.015
AKP YFS LHD
Ryer et al. 2012.
Temperature
2 4 6 8 10 12 14 16
Specific growth rate
0.00 0.01 0.02 0.03
AKP YFS LHD NRS PH ES
0.000 0.005 0.010 0.015 0.020 0.025
*Talk by Planas and Hurst, Tuesday 11am.
Fish length (mm TL)
40 50 60 70 80 90 100
Maximum growth rate (SGR)
0.010 0.015 0.020 0.025 0.030 0.035 0.040
LHD 16° AKP 13° YFS 13° PH 16° ES 16° NRS 13°
Not enough size variation within each experiment to describe size-dependent variation in growth. But, likely not enough to be responsible for the observed differences in measured rates.
Fish length (mm TL)
40 50 60 70 80 90 100
Maximum growth rate (SGR)
0.010 0.015 0.020 0.025 0.030 0.035 0.040
Age 0 Age 1 But, because of differences in the timing of spawning and settlement: NRS, PH, ES were collected as age-0 AKP, YFS, and YFS were collected as age-1 Is there an age effect on growth potential, independent of the general decline in SGR with increasing size. H0: age-0 (pre-first winter) fish are “different” than age-1 (post-first winter)?
LHD 16° AKP 13° YFS 13° PH 16° ES 16° NRS 13°
Similar patterns observed among juvenile gadids.
Laurel et al. 2016
Temperature of maximum SGR
12 13 14 15 16 17
Delta T 50% SGR
4 6 8 10 12
NRS AKP LHD YFS ES PH
Calculate temperature of maximum SGR Calculate temperature range to 50% SGR
Temperature (°C)
2 4 6 8 10 12 14 16
Specific growth rate
0.000 0.005 0.010 0.015
Relative growth rate
0.0 0.2 0.4 0.6 0.8 1.0
Delta T Eurythermic Stenothermic LHD Representative? High mortality at these temps.
Yellowfin sole may be most sensitive to climate change because of their high thermal sensitivity.
Temperature of maximum SGR
12 13 14 15 16 17
Delta T 50% SGR
4 6 8 10 12
NRS AKP LHD YFS ES PH
Already have field evidence of sensitivity.
Matta et al. 2010. MEPS. Collected NRS, AKP, and YFS from Bering Sea where the species distrubutions overlap. Look at synchrony and climate drivers of annual growth rates. Otolith ring width index based on within individual, across year variation.
Temperature of maximum SGR
12 13 14 15 16 17
Delta T 50% SGR
4 6 8 10 12
NRS AKP LHD YFS ES PH
Eurythermic Stenothermic What about other parts of the distribution?
Matta et al. 2010. MEPS.
Yellowfin sole Northern rock sole
General models would predict that warming would allow northern rock sole to expand farther north, occupying waters currently inhabited by YFS and AKP. But, coastal temperatures do not follow latitudinal trends. Warming may reduce habitat suitability for the high latitude species even in the northern part of their range.
Temperature (°C)
2 5 9 13 16
Specific growth rate
0.000 0.005 0.010 0.015
Survival % 20 40 60 80 100