
SLIDE 1
Augsburg PKAL TIDES Proposal 3a 1/15/2014 2014-PKAL-TIDES-Augsburg-Proposal.pdf 1
2014 PKAL Augsburg Proposal
1
Teaching to Increase Diversity in STEM
Proposal by
- Dr. Milo Schield,
Management Information Systems Coordinator
Augsburg PKAL-TIDES Initial Proposal [Draft!]
2
AACU-PKAL issue a Call for Proposals Goal: to increase the “participation, retention and graduation of underrepresented groups in STEM.” “to reach nearly 100,000 students” Objective: “(Re)Design of multi-disciplinary curriculum that will enhance underrepresented student interest, competencies and retention in the computer/information sciences and related STEM disciplines.” www.aacu.org/pkal/tides/cfp.cfm
3
Funded by the Helmsley Trust
“In postsecondary education, the Trust is primarily interested in increasing the number of Science, Technology, Engineering and Mathematics (STEM) graduates who can participate in high growth sectors of the economy.” “The Trust also focuses on policy levers that improve postsecondary completion, particularly for underrepresented populations.”
www.aacu.org/pkal/tides/cfp.cfm
4
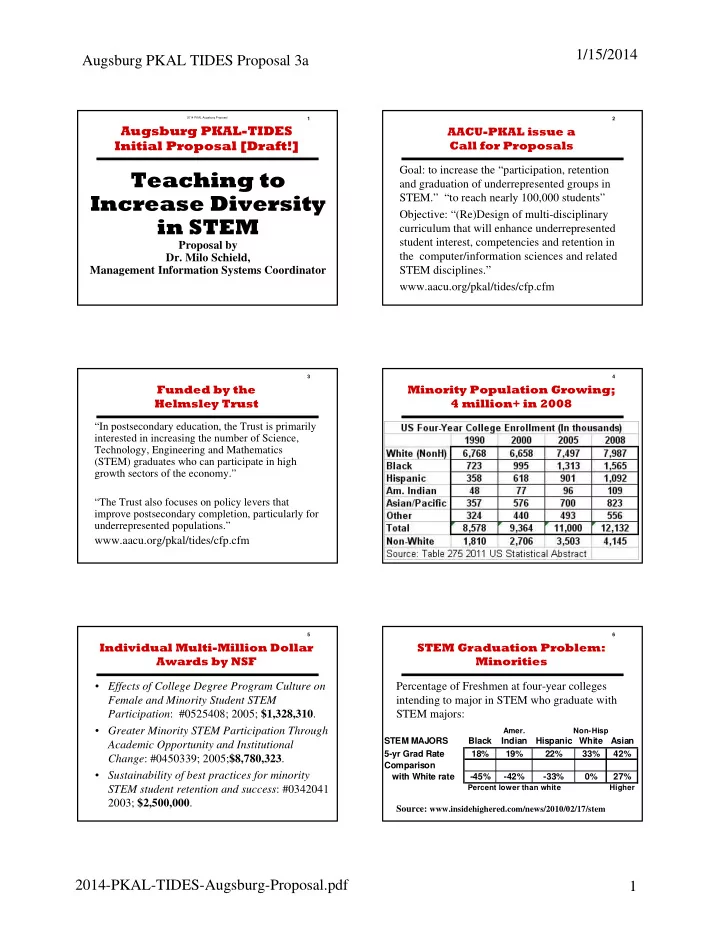
Minority Population Growing; 4 million+ in 2008
5
Individual Multi-Million Dollar Awards by NSF
- Effects of College Degree Program Culture on
Female and Minority Student STEM Participation: #0525408; 2005; $1,328,310.
- Greater Minority STEM Participation Through
Academic Opportunity and Institutional Change: #0450339; 2005;$8,780,323.
- Sustainability of best practices for minority
STEM student retention and success: #0342041 2003; $2,500,000.
6
STEM Graduation Problem: Minorities Percentage of Freshmen at four-year colleges intending to major in STEM who graduate with STEM majors:
Source: www.insidehighered.com/news/2010/02/17/stem
Amer. Non-Hisp
STEM MAJORS Black Indian Hispanic White Asian 5-yr Grad Rate 18% 19% 22% 33% 42% Comparison with White rate
- 45%
- 42%
- 33%
0% 27%
Percent lower than white Higher