SLIDE 1
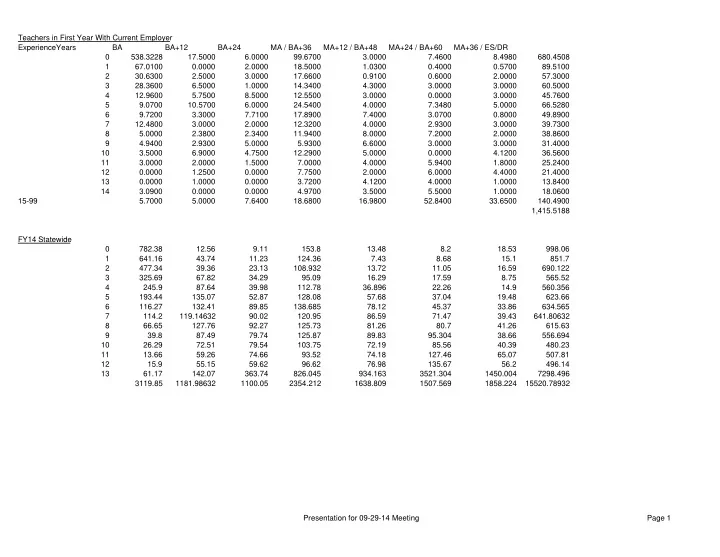
Teachers in First Year With Current Employer ExperienceYears BA BA+12 BA+24 MA / BA+36 MA+12 / BA+48 MA+24 / BA+60 MA+36 / ES/DR 538.3228 17.5000 6.0000 99.6700 3.0000 7.4600 8.4980 680.4508 1 67.0100 0.0000 2.0000 18.5000 1.0300 0.4000 0.5700 89.5100 2 30.6300 2.5000 3.0000 17.6600 0.9100 0.6000 2.0000 57.3000 3 28.3600 6.5000 1.0000 14.3400 4.3000 3.0000 3.0000 60.5000 4 12.9600 5.7500 8.5000 12.5500 3.0000 0.0000 3.0000 45.7600 5 9.0700 10.5700 6.0000 24.5400 4.0000 7.3480 5.0000 66.5280 6 9.7200 3.3000 7.7100 17.8900 7.4000 3.0700 0.8000 49.8900 7 12.4800 3.0000 2.0000 12.3200 4.0000 2.9300 3.0000 39.7300 8 5.0000 2.3800 2.3400 11.9400 8.0000 7.2000 2.0000 38.8600 9 4.9400 2.9300 5.0000 5.9300 6.6000 3.0000 3.0000 31.4000 10 3.5000 6.9000 4.7500 12.2900 5.0000 0.0000 4.1200 36.5600 11 3.0000 2.0000 1.5000 7.0000 4.0000 5.9400 1.8000 25.2400 12 0.0000 1.2500 0.0000 7.7500 2.0000 6.0000 4.4000 21.4000 13 0.0000 1.0000 0.0000 3.7200 4.1200 4.0000 1.0000 13.8400 14 3.0900 0.0000 0.0000 4.9700 3.5000 5.5000 1.0000 18.0600 15-99 5.7000 5.0000 7.6400 18.6800 16.9800 52.8400 33.6500 140.4900 1,415.5188 FY14 Statewide 782.38 12.56 9.11 153.8 13.48 8.2 18.53 998.06 1 641.16 43.74 11.23 124.36 7.43 8.68 15.1 851.7 2 477.34 39.36 23.13 108.932 13.72 11.05 16.59 690.122 3 325.69 67.82 34.29 95.09 16.29 17.59 8.75 565.52 4 245.9 87.64 39.98 112.78 36.896 22.26 14.9 560.356 5 193.44 135.07 52.87 128.08 57.68 37.04 19.48 623.66 6 116.27 132.41 89.85 138.685 78.12 45.37 33.86 634.565 7 114.2 119.14632 90.02 120.95 86.59 71.47 39.43 641.80632 8 66.65 127.76 92.27 125.73 81.26 80.7 41.26 615.63 9 39.8 87.49 79.74 125.87 89.83 95.304 38.66 556.694 10 26.29 72.51 79.54 103.75 72.19 85.56 40.39 480.23 11 13.66 59.26 74.66 93.52 74.18 127.46 65.07 507.81 12 15.9 55.15 59.62 96.62 76.98 135.67 56.2 496.14 13 61.17 142.07 363.74 826.045 934.163 3521.304 1450.004 7298.496 3119.85 1181.98632 1100.05 2354.212 1638.809 1507.569 1858.224 15520.78932 Presentation for 09-29-14 Meeting Page 1
SLIDE 2
FY15 Projected Statewide 792.1068 12.7161 9.2233 155.7121 13.6476 8.3019 18.7604 1,010.4682 1 649.1311 44.2838 11.3696 125.9061 7.5224 8.7879 15.2877 862.2886 2 483.2744 39.8493 23.4176 110.2863 13.8906 11.1874 16.7963 698.7018 3 329.7391 68.6632 34.7163 96.2722 16.4925 17.8087 8.8588 572.5507 4 248.9571 88.7296 40.4770 114.1821 37.3547 22.5367 15.0852 567.3225 5 195.8449 136.7492 53.5273 129.6723 58.3971 37.5005 19.7222 631.4135 6 117.7155 134.0562 90.9670 140.4092 79.0912 45.9341 34.2810 642.4541 7 115.6198 120.6276 91.1392 122.4537 87.6665 72.3585 39.9202 649.7854 8 67.4786 129.3483 93.4171 127.2931 82.2702 81.7033 41.7730 623.2837 9 40.2948 88.5777 80.7314 127.4349 90.9468 96.4888 39.1406 563.6150 10 26.6168 73.4115 80.5289 105.0398 73.0875 86.6237 40.8921 486.2004 11 13.8298 59.9967 75.5882 94.6827 75.1022 129.0446 65.8790 514.1232 12 16.0977 55.8356 60.3612 97.8212 77.9370 137.3567 56.8987 502.3082 13 61.9305 143.8363 368.2621 836.3146 945.7768 3,565.0818 1,468.0309 7,389.2330 3,158.6369 1,196.6811 1,113.7261 2,383.4802 1,659.1831 4,320.7147 1,881.3260 15,713.7482 FY15 Minimum Salary: $31,750 MA MA + 12 MA + 24 MA + 36 BA BA + 12 BA + 24 BA + 36 BA + 48 BA + 60 PhD $23,354 $24,230 $25,138 $26,081 $27,059 $28,074 $29,127 1 $24,230 $25,138 $26,081 $27,059 $28,074 $29,127 $30,219 2 $25,138 $26,081 $27,059 $28,074 $29,127 $30,219 $31,352 3 $26,081 $27,059 $28,074 $29,127 $30,219 $31,352 $32,528 4 $27,059 $28,074 $29,127 $30,219 $31,352 $32,528 $33,748 5 $28,074 $29,127 $30,219 $31,352 $32,528 $33,748 $35,013 6 $29,127 $30,219 $31,352 $32,528 $33,748 $35,013 $36,326 7 $30,219 $31,352 $32,528 $33,748 $35,013 $36,326 $37,688 8 $31,352 $32,528 $33,748 $35,013 $36,326 $37,688 $39,102 9 $32,528 $33,748 $35,013 $36,326 $37,688 $39,102 $40,568 10 $32,528 $35,013 $36,326 $37,688 $39,102 $40,568 $42,089 11 $32,528 $35,013 $36,326 $37,688 $40,568 $42,089 $43,668 12 $32,528 $35,013 $36,326 $37,688 $40,568 $43,668 $45,305 13+ $32,528 $35,013 $36,326 $37,688 $40,568 $43,668 $47,004 Presentation for 09-29-14 Meeting Page 2
SLIDE 3
The Career Ladder as recommended by the 2013 Task Force for Improving Education called for a 5-6 year implementation. In addition, further funding was proposed for tiers two and three that teachers could earn for fulfillment of leadership responsibilities, including such things as curriculum development work, chairing collaboration teams, mentoring, and other responsibilities that the districts may determine. The 2014 legislature appropriated the $15.8 million for the these "leadership premiums." That ongoing amount is not reflected in the implementation plan presented on the following pages. Fiscal Impact Table FTE Transition Cost $31,750 4,827.1094 $32,528 609.4589 $33,748 436.1255 $35,013 694.4273 $36,326 901.0850 $37,688 1,346.4286 $39,102 211.3493 $40,568 1,224.5804 $42,089 169.9368 $43,668 3,768.3175 $45,305 56.8987 $47,004 1,468.0309 Total FTE: 15,713.7482 Leadership Award Pool at $850 per FTE: $15,890,449 Total Year 1 Extra Cost: $15,890,449 The present salary cohorts, shown on Page 2, go in different cells in year 0. As we progress through the transition, the cohorts generally stay intact, with some consolidation occurring at the top of the professional salary range. The transition is effected as the cohorts move to different cells in different years. The transition really takes 6 years, since year 0 is where we are now, and year 1 is where the transition begins. Presentation for 09-29-14 Meeting Page 3
SLIDE 4
Salary Reimbursement Table
1 2 3 4 5 6 7 8 9 10 Res/Prof(<3 yrs) Teacher $31,000 $31,750 $32,528 Professional Teacher $33,748 $35,013 $36,326 $37,688 $39,102 $40,568 $42,089 $43,668 $45,305 $47,004 Master Teacher $48,000 $49,000 $50,000 $51,000 $52,000
FTE Table
1 2 3 4 5 6 7 8 9 10 Res/Prof(<3 yrs) Teacher 0.00 4928.08 621.75 Professional Teacher 445.13 708.53 919.87 1374.19 215.42 1250.65 173.56 3846.90 58.19 1498.74 Master Teacher
Salary Reimbursement Table
1 2 3 4 5 6 7 8 9 10 Res/Prof(<3 yrs) Teacher $0 $156,466,457 $20,224,364 Professional Teacher $15,022,242 $24,807,844 $33,415,086 $51,790,293 $8,423,288 $50,736,430 $7,304,958 $167,986,513 $2,636,460 $70,446,771 Master Teacher subtotals $15,022,242 $181,274,300 $53,639,450 $51,790,293 $8,423,288 $50,736,430 $7,304,958 $167,986,513 $2,636,460 $70,446,771 Career Ladder Cost: $609,260,707 FTE 16041.01
Career Ladder Year 0 Impact
Presentation for 09-29-14 Meeting Page 4
SLIDE 5
Salary Reimbursement Table
1 2 3 4 5 6 7 8 9 10 Res/Prof(<3 yrs) Teacher $32,800 $33,600 $34,422 Professional Teacher $36,398 $37,610 $38,661 $39,950 $41,082 $42,454 $43,671 $45,134 $47,004 $47,803 Master Teacher
FTE Table
1 2 3 4 5 6 7 8 9 10 Res/Prof(<3 yrs) Teacher 694.58 4,714.69 594.83 Professional Teacher 425.86 677.85 880.04 1,314.68 206.09 1,196.50 166.04 3,680.33 55.67 1,433.84 Master Teacher
Salary Reimbursement Table
1 2 3 4 5 6 7 8 9 10 Res/Prof(<3 yrs) Teacher $22,782,083 $158,413,639 $20,475,496 Professional Teacher $15,500,467 $25,494,319 $34,022,923 $52,522,112 $8,466,537 $50,796,617 $7,251,370 $166,109,535 $2,616,891 $68,542,355 Master Teacher subtotals $38,282,550 $183,907,958 $54,498,419 $52,522,112 $8,466,537 $50,796,617 $7,251,370 $166,109,535 $2,616,891 $68,542,355 Career Ladder Cost: $632,994,343 FTE 16041.01 Total System Cost Increase over Previous Year: $23,733,636
Career Ladder Year 1 Impact
Presentation for 09-29-14 Meeting Page 5
SLIDE 6
Salary Reimbursement Table
1 2 3 4 5 6 7 8 9 10 Res/Prof(<3 yrs) Teacher $34,600 $35,450 $36,317 Professional Teacher $39,049 $40,208 $40,996 $42,213 $43,061 $44,341 $45,253 $46,601 $47,583 $48,602 Master Teacher
FTE Table
1 2 3 4 5 6 7 8 9 10 Res/Prof(<3 yrs) Teacher 694.58 664.50 4,510.55 Professional Teacher 569.07 407.42 648.50 841.93 1,257.76 197.17 1,144.69 158.85 3,520.97 1,425.02 Master Teacher
Salary Reimbursement Table
1 2 3 4 5 6 7 8 9 10 Res/Prof(<3 yrs) Teacher $24,032,319 $23,556,545 $163,808,578 $0 Professional Teacher $22,221,673 $16,381,308 $26,585,724 $35,540,270 $54,160,536 $8,742,542 $51,801,111 $7,402,767 $167,538,445 $69,259,496 Master Teacher subtotals $46,253,992 $39,937,853 $190,394,302 $35,540,270 $54,160,536 $8,742,542 $51,801,111 $7,402,767 $167,538,445 $69,259,496 Career Ladder Cost: $671,031,314 FTE 16041.01 Total System Cost Increase over Previous Year: $38,036,971
Career Ladder Year 2 Impact
Presentation for 09-29-14 Meeting Page 6
SLIDE 7
Salary Reimbursement Table
1 2 3 4 5 6 7 8 9 10 Residency Teacher $36,400 $37,300 $38,211 Professional Teacher $41,699 $42,805 $43,330 $44,475 $45,041 $46,227 $46,836 $48,067 $48,722 $49,402 Master Teacher
FTE Table
1 2 3 4 5 6 7 8 9 10 Residency Teacher 694.58 664.50 635.73 Professional Teacher 4,315.24 544.43 389.78 620.42 805.48 1,203.30 188.63 1,095.12 151.98 4,731.83 Master Teacher
Salary Reimbursement Table
1 2 3 4 5 6 7 8 9 10 Residency Teacher $25,282,556 $24,785,871 $24,291,918 Professional Teacher $179,942,008 $23,304,585 $16,889,109 $27,593,381 $36,279,261 $55,625,021 $8,834,584 $52,639,585 $7,404,599 $233,760,136 Master Teacher subtotals $205,224,564 $48,090,456 $41,181,027 $27,593,381 $36,279,261 $55,625,021 $8,834,584 $52,639,585 $7,404,599 $233,760,136 Career Ladder Cost: $716,632,613 FTE 16041.01 Total System Cost Increase over Previous Year: $45,601,299
Career Ladder Year 3 Impact
Presentation for 09-29-14 Meeting Page 7
SLIDE 8
Salary Reimbursement Table
1 2 3 4 5 6 7 8 9 10 Residency Teacher $38,200 $39,150 $40,106 Professional Teacher $44,350 $45,403 $45,665 $46,738 $47,020 $48,114 $48,418 $49,534 $49,861 $50,201 Master Teacher $52,800
FTE Table
1 2 3 4 5 6 7 8 9 10 Residency Teacher 755.40 664.50 635.73 Professional Teacher 547.38 4,128.39 520.86 372.90 593.56 655.01 978.51 153.39 890.55 3,971.49 Master Teacher 1,173.35
Salary Reimbursement Table
1 2 3 4 5 6 7 8 9 10 Residency Teacher $28,856,118 $26,015,197 $25,496,241 Professional Teacher $24,276,112 $187,439,595 $23,785,154 $17,428,348 $27,909,310 $31,514,824 $47,377,523 $7,598,093 $44,403,716 $199,371,961 Master Teacher $61,952,622 subtotals $115,084,852 $213,454,793 $49,281,395 $17,428,348 $27,909,310 $31,514,824 $47,377,523 $7,598,093 $44,403,716 $199,371,961 Career Ladder Cost: $753,424,814 FTE 16041.01 Total System Cost Increase over Previous Year: $36,792,201
Career Ladder Year 4 Impact
Presentation for 09-29-14 Meeting Page 8
SLIDE 9
Salary Reimbursement Table
1 2 3 4 5 6 7 8 9 10 Residency Teacher $40,000 $41,000 $42,000 Professional Teacher $47,000 $48,000 $49,000 $50,000 $51,000 Master Teacher $54,000 $55,000 $56,000 $57,000 $58,000
FTE Table
1 2 3 4 5 6 7 8 9 10 Residency Teacher 755.40 722.69 635.73 Professional Teacher 547.38 4,473.31 855.06 1,134.78 5,447.69 Master Teacher 346.45 1,122.54
Salary Reimbursement Table
1 2 3 4 5 6 7 8 9 10 Residency Teacher $30,215,831 $29,630,172 $26,700,563 Professional Teacher $25,726,889 $214,718,823 $41,897,823 $56,738,903 $277,832,122 Master Teacher $18,708,063 $61,739,660 subtotals $74,650,783 $306,088,656 $68,598,387 $56,738,903 $277,832,122 $0 $0 $0 $0 $0 Career Ladder Cost: $783,908,851 FTE 16041.01 Total System Cost Increase over Previous Year: $30,484,036 Assumed annual average net retention rate: 0.9567 percent eligible for Master in year 4 0.60 percent of those eligible that advance to Professional 0.90 percent of those eligible that advance to Master 0.25 percent eligible for master after year 4 0.20 Years in transition 5
Career Ladder Year 5 Impact -- Full Implementation
Presentation for 09-29-14 Meeting Page 9