TEACHER EVALUATION IN NEW YORK CITY Aaron M. Pallas T eachers - - PDF document

teacher evaluation in new york city
SMART_READER_LITE
LIVE PREVIEW

TEACHER EVALUATION IN NEW YORK CITY Aaron M. Pallas T eachers - - PDF document

5/29/2019 AUTOMATED DECISION SYSTEMS FOR TEACHER EVALUATION IN NEW YORK CITY Aaron M. Pallas T eachers College, Columbia University 1 ADVANCE UNDER STATE LAW 3012-D MOSL Highly Effective Effective Developing Ineffective Highly


slide-1
SLIDE 1

5/29/2019 1

AUTOMATED DECISION SYSTEMS FOR TEACHER EVALUATION IN NEW YORK CITY

Aaron M. Pallas T eachers College, Columbia University

1

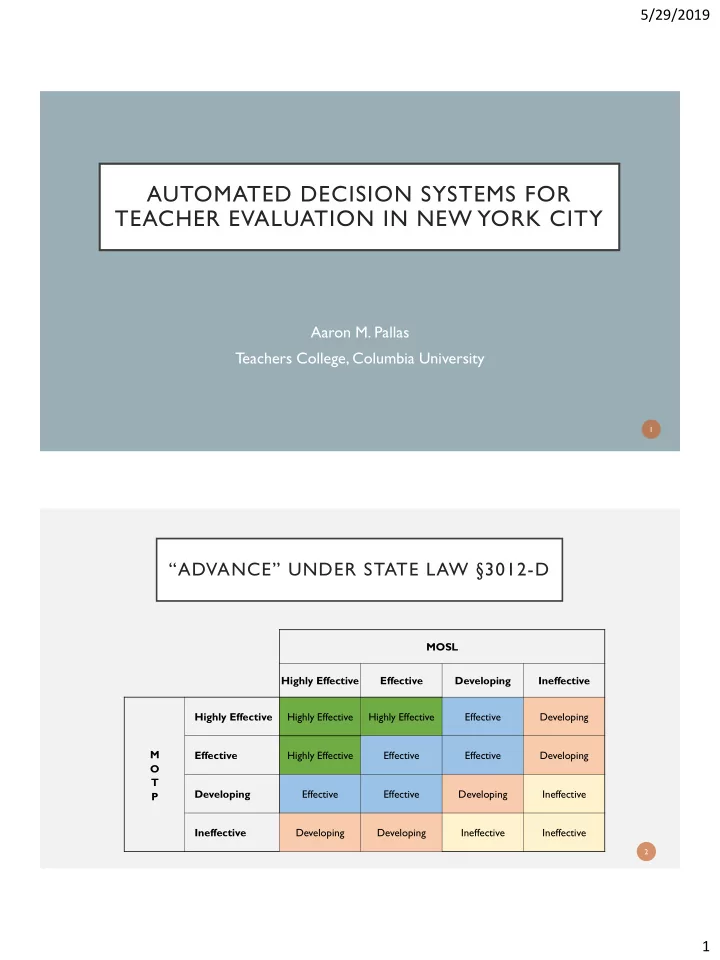
“ADVANCE” UNDER STATE LAW §3012-D

MOSL Highly Effective Effective Developing Ineffective M O T P Highly Effective Highly Effective Highly Effective Effective Developing Effective Highly Effective Effective Effective Developing Developing Effective Effective Developing Ineffective Ineffective Developing Developing Ineffective Ineffective

2

slide-2
SLIDE 2

5/29/2019 2

WHO COMES UP WITH THIS STUFF?

 NYC DOE Office of Talent Research & Data  Education Analytics (spin-off of Value-Added Research Center at University of Wisconsin-Madison) T echnical Advisory Committee

Heather Adams, New York State United T eachers Rob Meyer, Founder & President of Education Analytics Aaron M. Pallas, Professor of Sociology and Education, T eachers College, Columbia University

3

GUIDING PRINCIPLES

 Fairness  Feasibility  Instructional Viability  Developmental Support  Reliability and Validity  School-Level Autonomy Transparency

4

slide-3
SLIDE 3

5/29/2019 3

THE LOGIC OF THE GROWTH MODEL

 Use “business rules” to link and attribute students to teachers  Use statistical tools to find similar students taught by other teachers (re prior academic performance, demographic, school and classroom characteristics)  Examine how each teacher’s student performed on an end-of-year assessment compared to similar students taught by other teachers  Calculate Student Growth Percentile for each student, ranked against other similar students  Calculate teacher’s Mean Growth Percentile across all students  Adjust for imprecision and uncertainty  Assign a HEDI score and value

5

MORE THAN 100 END-OF-YEAR ASSESSMENTS

NYSED Exams, 4th & 8th Grade, Science Scantron Performance Series, Grades 3-8, HS in Reading and Math NYS Regents Exams in Math, Science, English and Social Studies Fountas & Pinnell Running Records (F&P), Grades K-5, ELA New York State English as a Second Language Achievement T est (NYSESLAT), Grades K-8 & HS T eachers College Reading and Writing Project Running Records (TCRWP), Grades K-5, ELA NYC Performance Tasks (NYCPT), K-12, ELA, Math, Science, Social Studies, Visual Arts Degrees of Reading Power (DRP), ELA Grades 6-8

6

slide-4
SLIDE 4

5/29/2019 4

JUST ONE OF SEVERAL GORY EQUATIONS

𝑍

𝑗𝑢 = 𝜂 + 𝜇𝑞𝑍 𝑞𝑗,𝑢−1 𝑄 𝑞=1

𝐽𝑞𝑗 + 𝜇𝑟𝑍

𝑟𝑗,𝑢−1 𝑅 𝑟=1

𝐽𝑟𝑗 + 𝜇𝑠𝑍

𝑠𝑗,𝑢−1 𝑆 𝑠=1

𝐽𝑠𝑗 + + 𝛿𝑞𝐽𝑞𝑗

𝑄 𝑞=2

𝛿𝑟𝐽𝑟𝑗

𝑅 𝑟=2

+ 𝐶′𝑌𝑗 + 𝜌′𝑎𝑗 + 𝜀′𝑋

𝑗 + 𝜗𝑗𝑢

7

WHAT’S THE RESULT?

MOSL Rating Category Percentage of T eachers Highly Effective 6% Effective 81% Developing 9% Ineffective 4%

8

slide-5
SLIDE 5

5/29/2019 5

TRANSPARENCY

 Overall Advance ratings e-mailed September 1(start of the next school year)  Link to Overall Rating Report with data on each student attributed to teacher

 Pretest scores  End-of-Year assessment scores  Student Growth Percentiles  Enrollment  Attendance

 Model Technical Report posted on DOE Intranet available to DOE employees

9