
SLIDE 1
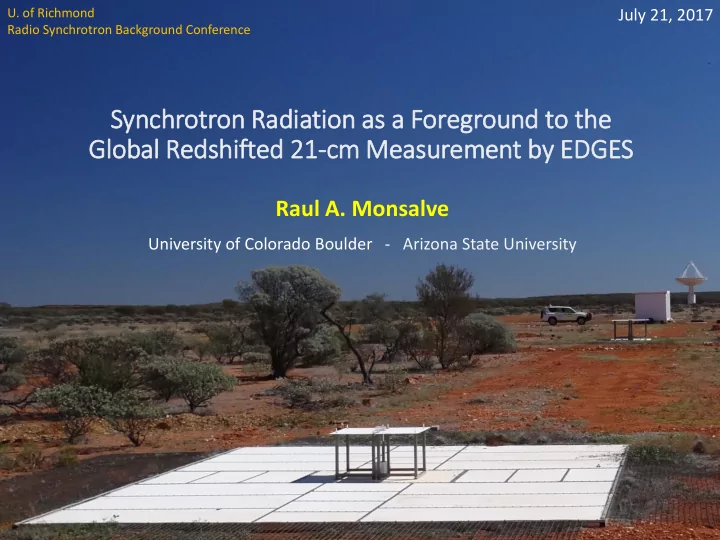
Synchrotron Radia iatio ion as s a Foreground to th the Glo lobal l Redshif ifted 21 21-cm Measurement by EDGES
Raul A. Monsalve
University of Colorado Boulder - Arizona State University
- U. of Richmond
Radio Synchrotron Background Conference
July 21, 2017