
SUSY Strong Production Searches @ ATLAS
Christopher Young
18th March 2012
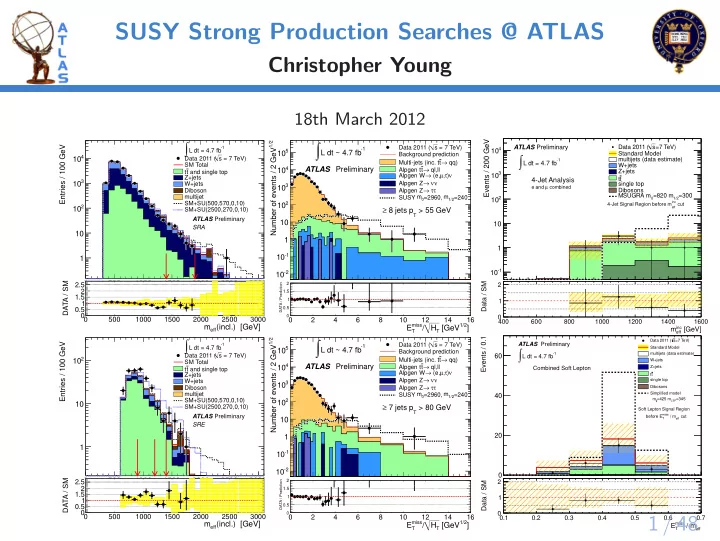
500 1000 1500 2000 2500 3000 Entries / 100 GeV 1 10
2
10
3
10
4
10
- 1
L dt = 4.7 fb
∫
= 7 TeV) s Data 2011 ( SM Total and single top t t Z+jets W+jets Diboson multijet SM+SU(500,570,0,10) SM+SU(2500,270,0,10) Preliminary ATLAS SRA
(incl.) [GeV]
eff
m 500 1000 1500 2000 2500 3000 DATA / SM 0.5 1 1.5 2 2.5
2 4 6 8 10 12 14 16 1/2
Number of events / 2 GeV
- 2
10
- 1
10 1 10
2
10
3
10
4
10
5
10
- 1
L dt ~ 4.7 fb
∫
> 55 GeV
T
8 jets p ≥ ATLAS Preliminary
= 7 TeV) s Data 2011 ( Background prediction qq) → t Multi-jets (inc. t ql,ll → t Alpgen t ν ) τ , µ (e, → Alpgen W ν ν → Alpgen Z τ τ → Alpgen Z =240
1/2
m =2960, m SUSY
]
1/2
[GeV
T
H /
miss T
E 2 4 6 8 10 12 14 16
DATA / Prediction 0.5 1 1.5 2
[GeV]
inc eff
m 400 600 800 1000 1200 1400 1600 Data / SM 1 2 Events / 200 GeV
- 1
10 1 10
2
10
3
10
4
10
- 1
L dt = 4.7 fb
∫
ATLAS Preliminary 4-Jet Analysis
combined µ e and cut
inc eff
4-Jet Signal Region before m
=7 TeV) s Data 2011 ( Standard Model multijets (data estimate) W+jets Z+jets t t single top Dibosons =300
1/2
=820 m MSUGRA m
500 1000 1500 2000 2500 3000 Entries / 100 GeV 1 10
2
10
- 1
L dt = 4.7 fb
∫
= 7 TeV) s Data 2011 ( SM Total and single top t t Z+jets W+jets Diboson multijet SM+SU(500,570,0,10) SM+SU(2500,270,0,10) Preliminary ATLAS SRE
(incl.) [GeV]
eff
m 500 1000 1500 2000 2500 3000 DATA / SM 0.5 1 1.5 2 2.5
2 4 6 8 10 12 14 16 1/2
Number of events / 2 GeV
- 2
10
- 1
10 1 10
2
10
3
10
4
10
5
10
- 1
L dt ~ 4.7 fb
∫
> 80 GeV
T
7 jets p ≥ ATLAS Preliminary
= 7 TeV) s Data 2011 ( Background prediction qq) → t Multi-jets (inc. t ql,ll → t Alpgen t ν ) τ , µ (e, → Alpgen W ν ν → Alpgen Z τ τ → Alpgen Z =240
1/2
m =2960, m SUSY
]
1/2
[GeV
T
H /
miss T
E 2 4 6 8 10 12 14 16
DATA / Prediction 0.5 1 1.5 2
Events / 0.1 20 40 60
- 1
L dt = 4.7 fb
∫
ATLAS Preliminary Combined Soft Lepton
Soft Lepton Signal Region cut
eff
/ m
miss T
before E =7 TeV) s Data 2011 ( Standard Model multijets (data estimate) W+jets Z+jets t t single top Dibosons Simplified model =345
LSP=425 m
g ~m eff
/ m
miss T
E 0.1 0.2 0.3 0.4 0.5 0.6 0.7 Data / SM 1 2