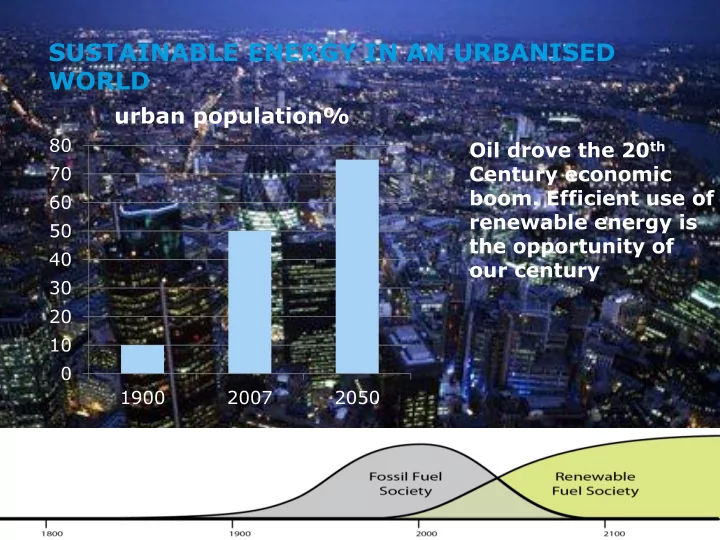
sustainable energy in an urbanised world
play

SUSTAINABLE ENERGY IN AN URBANISED WORLD urban population% 80 Oil - PowerPoint PPT Presentation

SUSTAINABLE ENERGY IN AN URBANISED WORLD urban population% 80 Oil drove the 20 th 70 Century economic boom. Efficient use of 60 renewable energy is 50 the opportunity of 40 our century 30 20 10 0 1900 2007 2050 URBANISATION


  1. SUSTAINABLE ENERGY IN AN URBANISED WORLD urban population% 80 Oil drove the 20 th 70 Century economic boom. Efficient use of 60 renewable energy is 50 the opportunity of 40 our century 30 20 10 0 1900 2007 2050

  2. URBANISATION – GREEN OR BLACK GROWTH? • Black urbanisation: • Poorly planned: Congestion? We • build a new road Deteriorisation of health • and the environment • more is less • Green urbanisation: Holistic planning • • Congestion? We shift mode • Less is more

  3. THE SUSTAINABLE CITY OF THE FUTURE

  4. Nordhavnen: Copenhagen – the sustainable city of the future • Five minute city - Promotes walking, cycling, and public transport at the expense of cars - Mixed use • CO 2 friendly city - Renewable energy - District solutions - Protection against climate changes • Intelligent grid - Staggered building zone structure - Dynamic structure - Flexible to adapt to future trends - The city will never be perceived as finished

  5. Energy efficiency: CREATE A GREEN CODE FOR LAKESIDE Lakeside will set new standards for resource efficient buildings • Designing for High-Performance, Greater Energy Efficiency and Comfort: Maximum limit to heat and cooling loads • All buildings must connect to district energy systems • Use low embodied-carbon and resource efficient building materials • Implement smart user controls, monitoring and feedback

  6. COPENHAGEN CO2 NEUTRAL BY 2025 • 98% of heat supply by district heating • Regional “fingerplan” supports high rate of public transport • Years of tradition of bicyclism • Good potential for geothermal heat • Easy access to imported biomass 2010/09/27 COPENHAGEN CLIMATE PLAN 2025

  7. SMART ENERGY CITY CONCEPT SMART INTELLIGENT GRIDS AND BUILDINGS • National power grid • City-wide district heating grid • storage • optimal use of CHP and RES • City district cooling grid • storage and optimal free cooling Climate Committee • National natural gas - biogas grid • gas storage, • gas to CHP and small houses 11 • • • • •

  8. SMART INFRASTRUCTURE IN THE BACK YARD • Avedøre • New power plant site located with respect to the heat market • CHP multi-fuel gas, coal, straw, wood pellets • CHP with 2x22.000 m 3 heat accumulators • Waste water treatment plant • Wind • Amager • CHP biomass, coal • Waste-to-energy • Geothermal energi • Waste water treatment plant 12 • Sludge incineration • •

  9. Energy SMART SUPPLY: DISTRICT ENERGY District energy offers the most affordable, clean, discrete and future proof energy supply. • Create district energy systems that provide Lakeside with heating, cooling, and power • Create energy generation facilities that can be phased with the development • Create a shared network for energy distribution • Extend the energy network into the adjacent community

  10. FLEXIBLE DISTRICT ENERGY

  11. AQUIFER THERMAL ENERGY STORAGE

  12. A BROWNFIELD DISTRICT ENERGY SYSTEM INTEGRATING WITH ITS NEIGHBOURS

  13. HEATING CO2 EMISSIONS – AN EXAMPLE

  14. Energy ENERGY FROM THE SUN Lakeside is neighbor to the largest solar field in USA. Lakeside can go solar too. • Buildings will be equipped with – or at least prepared for – solar panels • A design guide will secure a consistent visual expression of the installations. • Large solar rooftop installations could net- meter back to the neighborhood utility • The land to be developed during later phases could be used temporarily for solar fields

  15. Energy USE WIND POWER Lakeside has excellent wind resources, in particular offshore. We want to be a first mover. • Wind turbines on the breakwater: the Lakeside landmark • Initiate a large-scale offshore wind farm project off Lakeside • With 15 turbines Lakeside would be self- sufficient with electricity

  16. Energy USE LAKEWATER FOR DISTRICT COOLING The bottom of the lake is a reservoir of cold water which can be used as a Toronto district cooling using lakewater free energy source. • The existing cribs could be used to supply cooling water from the bottom of the lake • - or, a new long pipe will be extended far out into the lake • An underground cooling water distribution system will connect to all buildings needing cooling • The lukewarm return water will be pass through the Lakeside water bodies and help keep outdoor temperatures down, before being returned to the lake. • Costs of cooling will be dramatically reduced. Using lakewater Option using groundwater

  17. AN INTEGRATED URBAN ENERGY SYSTEM

  18. LARGE-SCALE HEAT STORAGE • Seasonal solar heat storage • Takes on big time in DK • Competitive with conventional heating • Seasonal storage in a smart grid: • Decoupling CHP from heat demand

  19. BALANCING WIND POWER IN DH SYSTEM Geothermal Heat pump Solar Thermal energy Wind storage CHP heat

  20. COST COMPARISON OF DIFFERENT MEASURES Costs Energy savings, kWh/m2 24

  21. Heat supply District heating District heating Solar th. Th. Storage District heating Solar th. Th. Storage Geothermal Electricity Wind power Wind power Conventional power Solar PV Conventional power Cooling Ground water cooling Ground water Cooling Cooling Conventional cooling cooling storage storage Sea water cooling BASELINE INTERMEDIATE LONG TERM

  22. FAST TRANSFORMATION THROUGH DISTRICT ENERGY: DENMARK 70 Case A: Moderately improved building envelope and expansion of district heating 60 50 Net heat demand in TWh 40 30 20 Biomass Solar heating (individual) Heat pumps (individual) Stoves, electricity 10 Central heating/with natural gas Central heating/with oil District heating 0 1980 1985 1990 1995 2000 2006 2010 2015 2020 2025 2030 2035 2040 2050 1,4 100% Disctrict Heating 90% 1,2 80% Share of fuel/energy to cover 1 unit of heat Share of combined heat and power production 1,0 70% 60% 0,8 50% Waste, biomass etc. Natural gas 0,6 Coal 40% Oil Share of combined production 30% 0,4 20% 0,2 10% 0,0 0% 1980 1985 1990 1995 2000 2006 2010 2015 2020 2025 2030 2035 2040 2050 26

  23. URBAN PLANNING MATTERS! CO2 emissioner, kontorbyggeri CO2 emission for new office building 5000 4500 4000 kg/m2 over 60 år 3500 Transport, 60 år Commuting 3000 Electricity El, 60 år 2500 Heating Varme, 60 år 2000 Materials Materialer 1500 1000 500 0 Individual transport Public transport periferi, n-gas City, fjernvarme individual heating district heating 27

  24. CO2 ækv. opgjort på brændsler Vind Alle virkemidler Olie 2.400 Non Energy 2.200 Naturgas Kul 2.000 Diesel 1.800 Benzin 1.600 Avgas 1.400 Affald 1.200 1.000 800 600 400 200 0 -200 -400 -600 -800 2005 2015 2025

Download Presentation
Download Policy: The content available on the website is offered to you 'AS IS' for your personal information and use only. It cannot be commercialized, licensed, or distributed on other websites without prior consent from the author. To download a presentation, simply click this link. If you encounter any difficulties during the download process, it's possible that the publisher has removed the file from their server.

Recommend


More recommend