
SLIDE 1
SUS BUDGET BALANCE SHEET - 2017-18 BUDGET Unrestricted Funds - - PowerPoint PPT Presentation
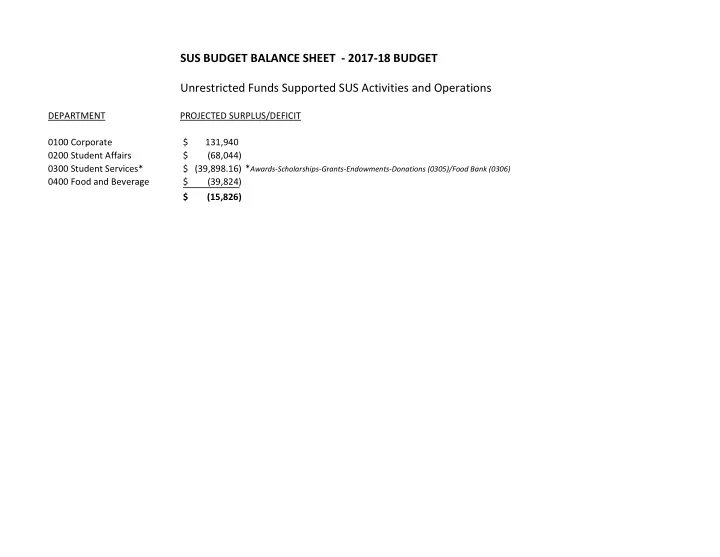
SUS BUDGET BALANCE SHEET - 2017-18 BUDGET Unrestricted Funds Supported SUS Activities and Operations DEPARTMENT PROJECTED SURPLUS/DEFICIT 0100 Corporate $ 131,940 0200 Student Affairs $ (68,044) 0300 Student Services* $ (39,898.16) *
Department>
Revenues Account Description April May June July August September October November December January February March Total 4000-0100 Student Union Society Membership Fees
32,520 30 255,740
224,986 35,663 677,230 4025-0100 Marketing (Advertising,Sponsorship etc.)
76
4030-0100 Program Subsidy 10,000
4040-0100 Chequing & General Interest Income 1,134 211 231 279 210 264 264 261 223 474 200 469 4,219 4050-0100 Restricted Donations
3,600
4056-0100 Unrestricted Donations
Wage Subsidies
Miscellaneous Income
4110-0100 Sales Revenue
Tenant Rent/Lease
Commercial Lease Profit Sharing
SUB Equipment Rentals
450
1,551 1,516 2,909 300 700 700 700 9,015 4140-0100 ATM 74
41 212 45 30 114 54 113 790 4145-0100 Vending Machine
407 434 490 2,247 4150-0100 Investment Fund Revenues
Asset Disposal
Miscellaneous Sales 22 22 22 19 22 22 22 22 22 19 22 22 258 4400-0100 Facilities Rental 81 7,084 1,656 2,500 310 3,230 1,525 3,820 400 928 2,298 3,319 27,151 Total Revenue 1,311 107,907 35,795 8,592 692 260,848 4,049 44,929 4,575 227,711 38,937 4,623 739,968 Expenses NOTE we need accounts for event labour cost revenues and event labour costs 5000-0100 Full Time Salaries 1,366 13,907 16,745 18,125 18,125 18,125 18,125 18,125 18,125 18,125 18,125 18,125 195,143 5008-0100 SUS Staff/Exec Teambuilding
149 50 86 200 200 929 200 200 200 3,494 5009-0100 Professional Development 803
236 236 236 235 235 2,500 5010-0100 Part Time Staff Costs 14,539 21,904 10,273 10,493 11,821 12,660 13,220 24,845 10,119 20,832 20,781 20,577 192,065 5020-0100 Honorarium 250 250 250 250 250 250 600 150 250 250 250 250 3,250 5030-0100 Full Time Benefits 2,018 2,222 3,492 3,079 3,206 3,836 3,593 3,213 3,444 3,444 3,444 3,444 38,434 5040-0100 Part Time Benefits 1,638 529 629 746 673 899 848 1,407 577 1,187 1,185 1,173 11,491 5050-0100 Professional Fees 6,056 2,363 5,036 8,225 6,370 437 1,929 2,166 1,500 1,500 1,500 1,500 38,582 5070-0100 Marketing, Advertising & Promotion
148 79 450 450 419 450 450 450 450 3,413 5080-0100 Licenses/Dues/Certificates
1,971 1,871 1,871 1,971 1,871 1,871 1,871 1,971 1,871 1,871 27,754 5090-0100 Cash Over/Short 30 30 30 30 30 30 30 30 30 30 30 30 360 5100-0100 Postage & Courier 30 30 30 30 30 30 30 30 30 30 30 30 360 5110-0100 Contracted Services 76
150 150 150 150 150 1,786 5115-0100 Contracted Custodial
1,457 5130-0100 IT Software/Hardware/Support 1,349 1,212 1,212 2,383 125 125 125 125 125 125 125 7,031 5138-0100 Cable & Internet 279 141 668 255 255 255 246 259 259 259 259 259 3,394 5139-0100 Telephone
540 300 180 300 300 310 310 310 310 310 3,740 5140-0100 Operating Supplies 1,570 2,457 294
200 200 200 200 200 5,399 5149-0100 Office Supplies 208 304 200 262 277 649 450 489 265 529 529 529 4,692 5150-0100 Small Equipment 185
177 194 288
100 100 100 100 1,363 5160-0100 Meetings 1,499 2,811 64 34 105 18 75 75 75 75 75 4,906 5170-0100 Internal Volunteer Recognition
400 600 5180-0100 Equipment Lease/Rental 157
157 157 628 5200-0100 Printing & Copying 23 202 104 140 214 105 102 67 150 150 150 150 1,557 5210-0100 Vehicle Op/Parking Pass 1,390 110 110 110 110 110 110 110 110 1,870 110 110 4,360 5220-0100 Program/Event Expenses
Conferences/Travel
2,801 3,627 120 240 2,514 2,315 420 3,960 18,154 5310-0100 Occupancy Charges
Repairs & Maintenance
50 50 50 50 250 5320-0100 Insurance 1,383 2,178 2,179 2,179 2,179 2,179 2,178 2,178 2,178 2,178 2,178 2,178 25,345 5325-0100 Credit Card & Bank Charges 45 65
45 50 6 50 50 50 50 461
5326-0100 Non-Deductible Interest Penalty 310 5330-0100 Payroll Services Fees 211 304 165 161 164 211 241 700 899 899 899 899 5,753 5335-0100 Bad Debt 306
5336-0100 Amortization
35,721 63,837 47,191 50,396 49,091 44,957 48,225 59,744 42,481 55,821 53,286 57,587 608,028 Surplus-Deficit 34,410
11,396
44,176
14,349
Department>
Revenues Account Description April May June July August September October November December January February March Total 4030-0201 Program Subsidy
Restricted Donations
Unrestricted Donations
Wage Subsidies
Miscellaneous
Ticket Sales
5000-0201 Full Time Salaries
Part Time Staff Costs 3,162 1,152 4,314 5020-0201 Honorarium 25 25 5030-0201 Full Time Benefits
Part Time Benefits 169 62 231 5050-0201 Professional Fees
Talent Fees (performers/speakers) 945 2,000 3,000 5,945 5070-0201 Marketing, Advertising & Promotion
Licenses, Dues, Certificates
Cash Over/Short
Postage & Courier
Contracted Services
Production (AV-PA) Services 1,477 1,477 5130-0201 IT (software, hardware, tech support)
Operating Supplies
Equipment 129 129 5160-0201 Meetings
Internal Volunteer Recognition
Equipment Lease/Rental
Telephone
Printing & Copying
Vehicle Op/Parking Pass
Program/Event Expenses 48 33 13,991 9,310 1,900 25,282 Total Orientation Expenses
978 16,120 14,143
Surplus-Deficit
(978) (16,120) (14,143)
Revenues April May June July August September October November December January February March Total 4030-0202 Program Subsidy
Restricted Donations
Unrestricted Donations
Wage Subsidies
Miscellaneous
Ticket Sales
Total Revenue
5000-0202 Full Time Salaries
Part Time Staff Costs
Honorarium
Full Time Benefits
Part Time Benefits
Professional Fees
Talent Fees (performers/speakers)
Marketing, Advertising & Promotion
Licenses, Dues, Certificates
Cash Over/Short
Postage & Courier
Contracted Services
Production (AV-PA) Services
IT (software, hardware, tech support)
Operating Supplies 372 372 5150-0202 Equipment
Meetings
Internal Volunteer Recognition
Equipment Lease/Rental
Telephone
Printing & Copying
Vehicle Op/Parking Pass
Program/Event Expenses 385 285 285 955 Total Pride Center Expenses
285 285 1,327 Surplus-Deficit
(285) (285) 1,327
Revenues Account Description April May June July August September October November December January February March Total 4030-0203 Program Subsidy
Restricted Donations
Unrestricted Donations
Wage Subsidies
Miscellaneous
Ticket Sales
5000-0203 Full Time Salaries
Part Time Staff Costs
Honorarium
Full Time Benefits
Part Time Benefits
Professional Fees
Talent Fees (performers/speakers)
Marketing, Advertising & Promotion
5080-0203 Licenses, Dues, Certificates
Cash Over/Short
Postage & Courier
Contracted Services
Production (AV-PA) Services
IT (software, hardware, tech support)
Operating Supplies 372 372 5150-0203 Equipment
Meetings
Internal Volunteer Recognition
Equipment Lease/Rental
Telephone
Printing & Copying
Vehicle Op/Parking Pass
Program/Event Expenses 385 285 285 955 Total Gender Equality Center Expenses
285 285 1,327 Surplus-Deficit
(285) (285) 1,327
Revenues April May June July August September October November December January February March Total 4030-0204 Program Subsidy
Restricted Donations
Unrestricted Donations
Wage Subsidies
Miscellaneous
Ticket Sales
5000-0204 Full Time Salaries
Part Time Staff Costs
Honorarium
Full Time Benefits
Part Time Benefits
Professional Fees
Talent Fees (performers/speakers)
Marketing, Advertising & Promotion
Licenses, Dues, Certificates
Cash Over/Short
Postage & Courier
Contracted Services
Production (AV-PA) Services
IT (software, hardware, tech support)
Operating Supplies
Equipment
Meetings
Internal Volunteer Recognition
Equipment Lease/Rental
Telephone
Printing & Copying
Vehicle Op/Parking Pass
5220-0204 Program/Event Expenses 5,742 1,014 8,253 $ 940 $ 1,339 $ 4,639 $ 6,061 $ 27,986 $ Total SUS Program-Events Expenses 5,742
8,253 940 1,339 4,639 6,061 27,986 Surplus-Deficit (5,742)
(8,253) (940) (1,339) (4,639) (6,061) 27,986
Department>
Note: FixIT is its own department given the COGS and operating contract with a party external to UFV and SUS
Revenues Account Description April May June July August September October November December January February March Total 4000-0301 Membership Fees 129,524 45,724 44 372,156 327,439 49,169 924,056 4010-0301 External Contribution
Marketing (Advertising,Sponsorship etc.)
Program Subsidy 20,000 20,000 4040-0301 Chequing & General Interest Income 322 325 512 519 678 726 609 633 661 657 640 648 6,929 4050-0301 Restricted Donations
Unrestricted Donations
Wage Subsidies
Miscellaneous 2,219 2,219 4100-0301 Ticket Sales
322 132,068 66,236 563 678 372,882 609 633 661 328,096 49,809 648 953,204 Expenses 5000-0301 Full Time Salaries
Part Time Staff Costs
Full Time Benefits
Part Time Benefits
Professional Fees
Marketing, Advertising & Promotion
Licenses, Dues, Certificates
Cash Over/Short
Postage & Courier
Contracted Services 2,540 $ 3,970 140,937 4,180 2,880 2,540 372,621 2,540 2,540 2,540 325,141 2,540 864,969.28 5130-0301 IT (software, hardware, tech support)
Operating Supplies
Equipment
Meetings
Equipment Lease/Rental
Printing & Copying
Vehicle Op/Parking Pass
Program/Event Expenses
Opt Out Rebates 43 42.90 Total Upass Expenses 2,583 3,970 140,937 4,180 2,880 2,540 372,621 2,540 2,540 2,540 325,141 2,540 865,012 Surplus-Deficit 2,261
74,701
372,012
275,332
Revenues Account Description April May June July August September October November December January February March Total 4000-0302 Membership Fees 82,190 29,582 27 231,130 32,084 203,356 25,000 603,369 4010-0302 External Contribution
Marketing (Advertising,Sponsorship etc.)
Program Subsidy 100,000 100,000 4040-0302 Chequing & General Interest Income 322 325 512 519 678 726 609 633 661 657 640 648 6,929 4050-0302 Restricted Donations
Unrestricted Donations
Wage Subsidies
Miscellaneous
Ticket Sales
Total Revenue 322 82,515 130,094 546 678 231,856 609 32,717 661 204,013 25,640 647.85 710,298 Expenses 5000-0302 Full Time Salaries
Part Time Staff Costs
Full Time Benefits
Part Time Benefits
Professional Fees
Marketing, Advertising & Promotion
Licenses, Dues, Certificates
Cash Over/Short
Postage & Courier
Contracted Services 41,939 41,608 41,608 35,516 36,815 65,387 74,137 75,840 26,218 75,840 74,137 75,840 664,885.44 5130-0302 IT (software, hardware, tech support) 430 430 430 430 430 430 430 430 430 430 430 430 5,160.00 5140-0302 Operating Supplies
Equipment
Meetings
Equipment Lease/Rental
Printing & Copying
Vehicle Op/Parking Pass
Program/Event Expenses
Opt Out Rebates
42,369 42,038 42,038 35,946 37,245 65,817 74,567 76,270 26,648 76,270 74,567 76,270 670,045 Surplus-Deficit 42,047
88,056 35,400
73,958
48,927
Revenues Account Description April May June July August September October November December January February March Total 4000-0303 Membership Fees 11,287 1,001,103 48,133 1,060,523 4010-0303 External Contribution
Marketing (Advertising,Sponsorship etc.)
Program Subsidy
Chequing & General Interest Income 322 326 648 4050-0303 Restricted Donations
Unrestricted Donations
Wage Subsidies
Miscellaneous 170 170 4100-0303 Ticket Sales
322 496 11,287
Expenses 5000-0303 Full Time Salaries
Part Time Staff Costs
Full Time Benefits
Part Time Benefits
Professional Fees
Marketing, Advertising & Promotion
Licenses, Dues, Certificates
Cash Over/Short
Postage & Courier
Contracted Services
68,422 68,422 396,073
5130-0303 IT (software, hardware, tech support)
Operating Supplies
Equipment
Meetings
5180-0303 Equipment Lease/Rental
Printing & Copying
Vehicle Op/Parking Pass
Program/Event Expenses
Opt Out Rebates
68,422 68,422
Surplus-Deficit 322 496 70,988
Revenues Account Description April May June July August September October November December January February March Total 4000-0304 Membership Fees
External Contribution
Marketing (Advertising,Sponsorship etc.)
Program Subsidy
Chequing & General Interest Income
Restricted Donations
Unrestricted Donations
Wage Subsidies
Miscellaneous
Ticket Sales
5000-0304 Full Time Salaries
Part Time Staff Costs
Full Time Benefits
Part Time Benefits
Professional Fees
Marketing, Advertising & Promotion
Licenses, Dues, Certificates
Cash Over/Short
Postage & Courier
Contracted Services
IT (software, hardware, tech support)
Operating Supplies
Equipment
Meetings
Equipment Lease/Rental
Printing & Copying
Vehicle Op/Parking Pass
Program/Event Expenses
Opt Out Rebates
Expenses April May June July August September October November December January February March Total 5400-0305 SIP - Student Association Funding 350 98 714 22 292 500 500 2,217 2,217 2,217 9,127 5401-0305 SIP - Student Clubs Funding 154 120 431 578 445 1,777 458 500 2,103 2,103 2,103 10,772
5402-0305 SIP - Student Research Projects
Student Awards
Scholarships 20,000
5420-0305 Endowment
Emergency Student Grants
Restricted Donations-External Programs
470 529 1,292 20,467 2,069 958 1,000 4,320 4,320 4,320 39,898 Surplus-Deficit
470 529 1,292 20,467 2,069 958 1,000 4,320 4,320 4,320 (39,898.16) $
Revenues Account Description April May June July August September October November December January February March Total 4005-0306 SUS Food Bank Fee
External Contribution
Restricted Donations
Unrestricted Donations
Wage Subsidies
Miscellaneous
5000-0306 Full Time Salaries
Part Time Staff Costs
Full Time Benefits
Part Time Benefits
Marketing, Advertising & Promotion
Licenses, Dues, Certificates
Courier, Postage, Freight
Contracted Services
Operating Supplies
Equipment
Meetings
Equipment Lease/Rental
Printing & Copying
Program/Event Expenses
Department>
Total Food and Beverage Revenues Departmental Sales/Cost of Goods/Gross Margin Totals April May June July August September October November December January February March Total Total Sales 6,933 3,565 5,561 6,465 2,314 14,192 17,320 23,390 3,366 13,580 9,440 19,487 125,613 Total Cost of Goods 2,879 2,769 3,086 2,204 2,735 7,538 7,701 10,394 1,565 6,378 4,434 9,153 60,836 Gross Margin 4,054 796 2,475 4,261 421
9,619 12,997 1,801 7,202 5,006 10,334 64,776 Gross Margin % 58.5% 22.3% 44.5% 65.9%
46.9% 55.5% 55.6% 53.5% 53.0% 53.0% 53.0% 51.6% COGS> 42% 78% 55% 34% 118% 53% 44% 44% 46% 47% 47% 47% 48%
Revenues Account Description April May June July August September October November December January February March Total 4200-0401 Food Sales 5,784 3,260 5,182 6,024 1,917 12,310 14,768 20,153 2,638 11,686 8,123 16,769 108,614 4200-0401 6200-0401 Food Cost of Goods 2,657 2,546 2,656 2,100 2,249 6,886 7,318 9,809 1,356 6,005 4,174 8,617 56,373 6200-0401 Gross Margin 3,127 714 2,526 3,924 332
7,450 10,344 1,283 5,681 3,949 8,152 52,241 COGS> 46% 78% 51% 35% 117% 56% 50% 49% 51% 51% 51% 51% 52% 4220-0401 Draught Sales
6220-0401 Draught Cost of Goods 27.00 273.00
6220-0401 Gross Margin
Bottled Beer Sales 48 37 94 347 557 659 87 384 267 551 3,030 4240-0401 6240-0401 Bottled Beer Cost of Goods 26 11 24 10
132 186 238 31 138 96 197 1,115 6240-0401 Gross Margin 26
47 47 215 371 422 56 246 171 353 1,915 COGS> #DIV/0! #DIV/0! 50.0%
50.0% 38.0% 33.4% 36.1% 35.8% 35.8% 35.8% 35.8% 36.8% 4260-0401 Liquor Sales 471 125 124 10 4 20 92 90 11 48 33 69 1,097 4260-0401 6260-0401 Liquor Cost of Goods 13 9 72
51
27 18 38 288 6260-0401 Gross Margin 458 116 124 10 76 178
90 5 21 15 31 808 4270-0401 Wine Sales
6270-0401 Wine Cost of Goods
Gross Margin
Miscellaneous Sales
2 7 9 5 37 17 3 15 10 21 305 4280-0401 6280-0401 Miscellaneous Cost of Goods 2
Gross Margin
2 7 9 5 39 17 3 15 10 21 308 4290-0401 Pop-Juice Sales 205 387 290 1,510 1,866 2,471 327 1,448 1,007 2,078 11,588 4290-0401 6290-0401 Pop-Juice Cost of Goods 107 176 133 114 511 322 149 347 47 209 145 300 2,561 6290-0401 Gross Margin 107
273 221
1,717 2,124 280 1,239 861 1,778 9,027 COGS> #DIV/0! #DIV/0! 64.9% 29.5% 176.2% 21.3% 8.0% 14.0% 14.5% 14.5% 14.5% 14.5% 22.1% Canoe Total Sales 6,255 3,565 5,561 6,465 2,314 14,192 17,320 23,390 3,066 13,580 9,440 19,487 124,635 Canoe Total Cost of Goods 2,803 2,769 3,086 2,204 2,735 7,538 7,701 10,394 1,440 6,378 4,434 9,153 60,635 Canoe Gross Margin 3,452 796 2,475 4,261 421
9,619 12,997 1,626 7,202 5,006 10,334 63,999 Canoe Gross Margin % 55.2% 22.3% 44.5% 65.9%
46.9% 55.5% 55.6% 53.0% 53.0% 53.0% 53.0% 51.3% COGS> 45% 78% 55% 34% 118% 53% 44% 44% 47% 47% 47% 47% 49% Expenses Expenses 5000-0401 Full Time Salaries
5010-0401 Part Time Staff Costs 6,682 3,060 2,684 2,708 2,768 6,135 8,614 18,623 7,763 12,540 11,346 13,137 96,060 5010-0401 5030-0401 Full Time Benefits
5040-0401 Part Time Benefits 390 157 131 224 127 376 548 995 442 715 647 749 5,501 5040-0401 5050-0401 Professional Fees
5080-0401 Licenses, Dues, Certificates 220 520 325 40 55 350 1,510 5080-0401
5090-0401 Cash Over/Short 3 1
9
5 5 5 5 14 5090-0401 5100-0401 Postage & Courier 60 60 60 60 60 67 103 74 128 128 128 128 1,056 5100-0401 5110-0401 Contracted Services 1,084 100 1,184 5110-0401 5115-0401 Contracted Custodial
5130-0401 IT (software, hardware, tech support) 92 172 372 142 142 275 275 325 325 325 325 325 3,097 5130-0401 5140-0401 Operating Supplies 62 1,293 1,264 123 2,899 1,654 2,017 1,095 2,190 2,190 2,190 16,977 5140-0401 5149-0401 Office Supplies 26
75 11 15 15 15 15 176 5149-0401 5150-0401 Equipment 17 300 300 300 300 300 1,517 5150-0401 5180-0401 Equipment Lease/Rental 15 15 15 15 15 75 5180-0401 5200-0401 Printing & Copying 15 15 15 15 15 75 5200-0401 5210-0401 Vehicle Op/Parking Pass
5300-0401 Conferences/Travel
5310-0401 Occupancy Charges 1,752 1,067 1,067 1,067 1,067 1,067 1,067 1,334 1,334 1,334 1,334 1,334 14,826 5310-0401 5315-0401 Repairs & Maintenance 100 294 417 417 417 417 417 417 2,896 5315-0401 5325-0401 Credit Card & Bank Charges 419 539 219 236 224 203 263 263 263 263 263 263 3,418 5325-0401 5335-0401 Bad Debt
5650-0401 Glassware
5660-0401 Smallwares 50 50 50 50 50 250 5660-0401 5670-0401 Non-reusables
5680-0401 Promotion - Food
5685-0401 Staff Discount - Food 75 80 191 207 190 190 190 190 1,313 5685-0401 5690-0401 Spillage/Spoilage 27 626 153 221 258 38 257 257 257 257 2,351 5690-0401 5695-0401 Promotion - Non-Alc. Bev
Total Canoe Expenses 9,644 6,820 6,278 6,328 4,816 11,648 13,398 24,752 12,965 18,759 17,497 19,390 152,296 Surplus-Deficit 6,192
Revenues Account Description April May June July August September October November December January February March Total 4200-0402 Food Sales 9,497 8,031 6,938 2,456 2,698 9,135 9,457 7,744 1,731 8,602 4,174 18,334 88,798 6200-0402 Food Cost of Goods 1,451 1,100 1,158 525 270 3,684 2,847 3,328 610 3,029 1,470 6,457 25,929 Gross Margin 8,046 6,931 5,780 1,931 2,428 5,451 6,610 4,416 1,122 5,573 2,704 11,878 62,869 COGS> 15.3% 13.7% 16.7% 21.4% 10.0% 40.3% 30.1% 43.0% 35.2% 35.2% 35.2% 35.2% 29.2% 36.3% 4290-0402 Pop-Juice Sales 448 1,185 594 1,320 886 796 197 981 476 2,090 8,972 6290-0402 Pop-Juice Cost of Goods 214 155 219 155 430 554 488 523 96 476 231 1,014 4,554 Gross Margin 214
1,030 164 766 398 273 102 505 245 1,076 4,418 COGS> #DIV/0! #DIV/0! 48.9% 13.1% 72.4% 42.0% 55.1% 65.7% 48.5% 48.5% 48.5% 48.5% 50.8% 4300-0402 Coffee Sales 1,625 3,634 1,275 3,008 2,818 2,642 558 2,771 1,345 5,907 25,583 6300-0402 Coffee Cost of Goods 612 631 426 588 543 1,818 777 777 245 1,220 592 2,599 10,828 Gross Margin 612
3,046 732 1,190 2,041 1,865 312 1,552 753 3,308 14,755 COGS> #DIV/0! #DIV/0! 26.2% 16.2% 42.6% 60.4% 27.6% 29.4% 44.0% 44.0% 44.0% 44.0% 42.3% 4310-0402 Speciality Coffee Sales 2,088 8,769 9,756 10,200 1,897 9,424 4,572 20,086 66,793 6310-0402 Specialty Coffee Cost of Goods 869 446 757 871 833 3,619 3,128 3,661 695 3,456 1,677 7,365 27,376 Gross Margin 869
5,150 6,628 6,539 1,201 5,969 2,896 12,721 39,416 #DIV/0! #DIV/0! #DIV/0! #DIV/0! 39.9% 41.3% 32.1% 35.9% 36.7% 36.7% 36.7% 36.7% 41.0% 4320-0402 Tea Sales 555 3,710 4,844 4,686 874 4,340 2,106 9,251 30,366 6320-0402 Tea Cost of Goods 146 119 154 116 62 421 181 539 31 155 75 330 2,329 Gross Margin 146
3,289 4,663 4,147 842 4,186 2,031 8,921 28,037 COGS> #DIV/0! #DIV/0! #DIV/0! #DIV/0! 11.2% 11.3% 3.7% 11.5% 7.7% 7.7% 7.7% 7.7% 7.7% 4250-0402 Smoothie/Specialty Juice/Shakes Sales 588 2,648 1,650 783 331 1,646 799 3,509 11,955 6250-0402 Smoothie/Specialty Juice/Shakes Cost of Goods 82 56 316 368 197 877 186 301 74 365 177 779 3,778 Gross Margin 82
1,771 1,464 482 258 1,281 621 2,730 8,177 COGS> #DIV/0! #DIV/0! #DIV/0! #DIV/0! 33.5% 33.1% 11.3% 38.4% 22.2% 22.2% 22.2% 22.2% 31.6% 4280-0402 Miscellaneous Sales 25 1 8 11 45 6280-0402 Miscellaneous Cost of Goods
Gross Margin
11
Fairgrounds Total Sales 9,497 8,031 9,036 7,275 7,799 28,590 29,419 26,862 5,588 27,765 13,471 59,178 232,510 Fairgrounds Total Cost of Goods 3,374 2,507 3,030 2,623 2,335 10,973 7,607 9,129 1,751 8,700 4,221 18,544 74,794 Fairgrounds Gross Margin 6,123 5,524 6,006 4,652 5,464 17,617 21,812 17,733 3,837 19,065 9,250 40,634 157,716 Fairgrounds Gross Margin % 1 1 1 1 1 1 1 1 1 1 1 1 1 COGS> 35.5% 31.2% 33.5% 36.1% 29.9% 38.4% 25.9% 34.0% 31.3% 31.3% 31.3% 31.3% 32.2% Expenses 5000-0402 Full Time Salaries
Part Time Staff Costs 4,690 3,678 2,671 2,937 2,751 5,460 6,748 11,525 5,292 7,423 6,716 7,776 67,667 5030-0402 Full Time Benefits
Part Time Benefits 257 195 142 230 132 312 460 587 302 423 383 443 3,866 5050-0402 Professional Fees
Licenses, Dues, Certificates 82 7 7 7 7 7 7 7 7 82 7 7 233 5090-0402 Cash Over/Short 16 16
2
18 4 4 4 4 57 5100-0402 Postage & Courier 80 80 90 80 100 106 163
5110-0402 Contracted Services $422 $422 $422 $422 $422 $422 $422 $422 $422 $422 $422 $422 5,064 5115-0402 Contracted Custodial
IT (software, hardware, tech support) 31 57 257 88 88 222 221 222 222 222 222 222 2,074 5140-0402 Operating Supplies 47 637 737 1,116 2,408 2,826 2,300 1,381 2,762 2,762 2,762 19,740 5149-0402 Office Supplies 20 75 149 244 5150-0402 Equipment 150 150 150 150 150 750 5180-0402 Equipment Lease/Rental
Printing & Copying 50 50 50 50 50 250 5210-0402 Vehicle Op/Parking Pass
Conferences/Travel
Occupancy Charges
Repairs & Maintenance 100 100 100 100 100 100 600 5325-0402 Credit Card & Bank Charges 419 539 219 236 224 203 307 307 307 307 307 307 3,682 5335-0402 Bad Debt
Glassware
Smallwares
Non-reusables
Promotion - Food
Staff Discount - Food 167 290 386 648 322 322 322 322 2,779 5690-0402 Spillage/Spoilage 1 79 332 29 100 100 100 100 841 5695-0402 Promotion - Non-Alc. Bev 100 272 384 543 293 293 293 293 2,471 Total SUS Fairgrounds Expenses 5,997 5,009 4,465 4,825 5,512 9,702 12,190 16,908 8,952 12,660 11,838 12,959 111,017 Surplus-Deficit
126 515 1,541 173
9,622 825 5,115
2,588
46,700
Revenues April May June July August September October November December January February March Total Account Description 4200-0403 Food Sales 678
6200-0403 Food Cost of Goods 76 125 201 Gross Margin 602
4220-0403 Draught Sales
Draught Cost of Goods
Bottled Beer Sales
6240-0403 Bottled Beer Cost of Goods
Liquor Sales
Liquor Cost of Goods
Pop-Juice Sales
Pop-Juice Cost of Goods
Miscellaneous Sales
Miscellaneous Cost of Goods
678
Catering Services Total Cost of Goods 76
Catering Services Gross Margin 602
Catering Services Gross Margin % 88.8% #DIV/0! #DIV/0! #DIV/0! #DIV/0! #DIV/0! #DIV/0! #DIV/0! 58.3% #DIV/0! #DIV/0! #DIV/0! 79.4% Expenses 5000-0403 Full Time Salaries
Part Time Staff Costs
Full Time Benefits
Part Time Benefits
Professional Fees
Licenses, Dues, Certificates
Cash Over/Short
Postage & Courier 9 9 5110-0403 Contracted Services
Contracted Custodial
IT (software, hardware, tech support)
Operating Supplies 188 188 5149-0403 Office Supplies
Equipment 2,988 2,988 5180-0403 Equipment Lease/Rental
Printing & Copying
Vehicle Op/Parking Pass
Conferences/Travel
Occupancy Charges
Repairs & Maintenance
Credit Card & Bank Charges
Bad Debt
Glassware
Smallwares
Non-reusables
Promotion - Food
Staff Discount - Food
Spillage/Spoilage
Promotion - Non-Alc. Bev
Surplus-Deficit 602
Sales Mix
Revenues summer 2016-17 - Costs not segrated; are aggregated Account Description April May June July August September October November December January February March Total % Sales Mix 4200-0401 Food Sales 5784 3260 5182 6024 1917 12310 14768 20153 3046 14566 10214 21063 118286 90% Food Sales 4220-0401 Draught Sales 0.0% Draught Sales 4240-0401 Bottled Beer Sales 48 37 94 347 557 659 1742 1.3% Bottled Beer Sales 4260-0401 Liquor Sales 471 125 124 10 4 20 92 90 467 1009 619 1285 4316 3.3% Liquor Sales 4270-0401 Wine Sales 0.0% Wine Sales 4280-0401 Miscellaneous Sales 180 2 7 9 5 37 17 257 0.2% Miscellaneous Sales 4290-0401 Pop-Juice Sales 205 387 290 1510 1868 2471 6731 5.1% Pop-Juice Sales Canoe Total Sales 6255 3565 5561 6465 2314 14192 17322 23390 3513 15575 10833 22348 131332 SEPT/OCT/NOV "ISO" SEPTEMBER OCTOBER AVERAGE OF SEPT/OCT/NOV November Account Description September % Sales Mix Account Description October % Sales Mix Account Description October % Sales Mix 4200-0401 Food Sales 12,310 $ 86.7% 4200-0401 Food Sales 14768 85.3% 86% Food Sales 4200-0401 Food Sales 20153 86.2% 4220-0401 Draught Sales 0.0% 4220-0401 Draught Sales 0.0% 0.0% Draught Sales 4220-0401 Draught Sales 0.0% 4240-0401 Bottled Beer Sales 347 $ 2.4% 4240-0401 Bottled Beer Sales 557 3.2% 2.8% Bottled Beer Sales 4240-0401 Bottled Beer Sales 659 2.8% 4260-0401 Liquor Sales 20 $ 0.1% 4260-0401 Liquor Sales 92 0.5% 0.4% Liquor Sales 4260-0401 Liquor Sales 90 0.4% 4270-0401 Wine Sales 0.0% 4270-0401 Wine Sales 0.0% 0.0% Wine Sales 4270-0401 Wine Sales 0.0% 4280-0401 Miscellaneous Sales 5 $ 0.0% 4280-0401 Miscellaneous Sales 37 0.2% 0.1% Miscellaneous Sales 4280-0401 Miscellaneous Sales 17 0.1% 4290-0401 Pop-Juice Sales 1,510 $ 10.6% 4290-0401 Pop-Juice Sales 1868 10.8% 10.7% Pop-Juice Sales 4290-0401 Pop-Juice Sales 2471 10.6% Canoe Total Sales 14,192 $ 100.0% Canoe Total Sales 17,322 $ 100.0% 100.0% Canoe Total Sales 23,390 $ 100.0%
Sales Mix
Revenues summer 2016-17 - Costs not segrated; are aggregated Account Description April May June July August September October November December January February March Total % Sales Mix 4200-0402 Food Sales 9497 8031 6938 2456 2698 9135 9457 7744 3500 17382 8429 37055 122322 66.8% 4290-0402 Pop-Juice Sales 448 1185 594 1320 886 796 5229 2.9% 4300-0402 Coffee Sales 1625 3634 1275 3008 2818 2643 15003 8.2% 4310-0402 Speciality Coffee Sales 2088 8769 9756 10200 30813 16.8% 4320-0402 Tea Sales 555 3710 4844 4686 13795 7.5% 4250-0402 Smoothie etc. 588 2648 1650 783 5669 3.1% 4280-0402 Miscellaneous Sales 25 1 8 11 45 0.0% 0.0% Fairgrounds Total Sales 9497 8031 9036 7275 7799 28590 29419 19915 3500 17382 8429 37055 183156 100.0% SEPT/OCT/NOV "ISO" SALES MIX SEPTEMBER OCTOBER COMBINED November Account Description September % Sales Mix Account 4200-0402 Food Sales 9,135 $ 32.0% 4200-0402 Food Sales 9,457 $ 32.1% 31.0% Food Sales Food Sales 7744 28.8% 4290-0402 Pop-Juice Sales 1,320 $ 4.6% 4290-0402 Pop-Juice Sales 886 $ 3.0% 3.5% Pop-Juice Sales Pop-Juice Sales 796 3.0% 4300-0402 Coffee Sales 3,008 $ 10.5% 4300-0402 Coffee Sales 2,818 $ 9.6% 10.0% Coffee Sales Coffee Sales 2643 9.8% 4310-0402 Speciality Coffee Sales 8,769 $ 30.7% 4310-0402 Speciality Coffee Sales 9,756 $ 33.2% 33.9% Speciality Coffee Sales Speciality Coffee 10200 38.0% 4320-0402 Tea Sales 3,710 $ 13.0% 4320-0402 Tea Sales 4,844 $ 16.5% 15.6% Tea Sales Tea Sales 4686 17.4% 4250-0402 Smoothie etc. 2,648 $ 9.3% 4250-0402 Smoothie etc. 1,650 $ 5.6% 5.9% Smoothie etc. Smoothie etc. 783 2.9% 4280-0402 Miscellaneous Sales 4280-0402 Miscellaneous Sales 8 $ 0.0% 0.0% Miscellaneous Sales Miscellaneous S 11 0.0% 100.0% 100.0% 100.0% Canoe Total Sales 28,590 $ 29,419 $ 26,863 $
COGS %
Revenues Account Description April May June July August September October November December January February March Total 4200-0401 Food Sales 5,784 $ 3,260 $ 5,182 $ 6,024 $ 1,917 $ 12,310 $ 14,768 $ 20,153 $ 3,046 $ 14,566 $ 10,214 $ 21,063 $ 118,287 $ 6200-0401 Food Cost of Goods 2,657 $ 2,546 $ 2,656 $ 2,100 $ 2,249 $ 6,886 $ 7,318 $ 9,809 $ 36,221 $ Gross Margin 3,127 $ 714 $ 2,526 $ 3,924 $ (332) $ 5,424 $ 7,450 $ 10,344 $ 3,046 $ 14,566 $ 10,214 $ 21,063 $ 82,066 $ COGS> 45.9% 78.1% 51.3% 34.9% 117.3% 55.9% 49.6% 48.7% 0.0% 0.0% 0.0% 0.0% 30.6% 4220-0401 Draught Sales 6220-0401 Draught Cost of Goods 27 $ 273 $ 300 $ Gross Margin
(27) $ (273) $
(300) $ #DIV/0! 4240-0401 Bottled Beer Sales 48 $ 37 $ 94 $ 347 $ 557 $ 659 $ 1,742 $ 6240-0401 Bottled Beer Cost of Goods 26 $ 11 $ 24 $ (10) $ 47 $ 132 $ 186 $ 238 $ 654 $ Gross Margin (26) $ (11) $ 24 $ 47 $ 47 $ 215 $ 371 $ 421 $
1,088 $ COGS> #DIV/0! #DIV/0! 50.0%
50.0% 38.0% 33.4% 36.1% #DIV/0! #DIV/0! #DIV/0! #DIV/0! 37.5% 4260-0401 Liquor Sales 471 $ 125 $ 124 $ 10 $ 4 $ 20 $ 92 $ 90 $ 467 $ 1,009 $ 619 $ 1,285 $ 4,316 $ 6260-0401 Liquor Cost of Goods 13 $ 9 $ (72) $ 198 $ 51 $ 199 $ Gross Margin 458 $ 116 $ 124 $ 10 $ 76 $ (178) $ 41 $ 90 $ 467 $ 1,009 $ 619 $ 1,285 $ 4,117 $ 4.6% 4270-0401 Wine Sales
6270-0401 Wine Cost of Goods
Gross Margin
4280-0401 Miscellaneous Sales
180 $ 2 $ 7 $ 9 $ 5 $ 37 $ 17 $ 257 $ 6280-0401 Miscellaneous Cost of Goods (2) $ (2) $ Gross Margin
180 $ 2 $ 7 $ 9 $ 5 $ 39 $ 17 $
259 $
4290-0401 Pop-Juice Sales 205 $ 387 $ 290 $ 1,510 $ 1,866 $ 2,471 $ 6,729 $ 6290-0401 Pop-Juice Cost of Goods 107 $ 176 $ 133 $ 114 $ 511 $ 322 $ 149 $ 347 $ 1,859 $ Gross Margin (107) $ (176) $ 72 $ 273 $ (221) $ 1,188 $ 1,717 $ 2,124 $
4,870 $ COGS> #DIV/0! #DIV/0! 64.9% 29.5% 176.2% 21.3% 8.0% 14.0% #DIV/0! #DIV/0! #DIV/0! #DIV/0! 27.6% Canoe Total Sales 6,255 $ 3,565 $ 5,561 $ 6,465 $ 2,314 $ 14,192 $ 17,320 $ 23,390 $ 3,513 $ 15,575 $ 10,833 $ 22,348 $ 131,331 $ Canoe Total Cost of Goods 2,803 $ 2,769 $ 3,086 $ 2,204 $ 2,735 $ 7,538 $ 7,702 $ 10,394 $
39,231 $ Canoe Gross Margin 3,452 $ 796 $ 2,475 $ 4,261 $ (421) $ 6,654 $ 9,618 $ 12,996 $ 3,513 $ 15,575 $ 10,833 $ 22,348 $ 92,100 $ Canoe Gross Margin % 55.2% 22.3% 44.5% 65.9%
46.9% 55.5% 55.6% 100.0% 100.0% 100.0% 100.0% 70.1% COGS> 44.8% 77.7% 55.5% 34.1% 118.2% 53.1% 44.5% 44.4% 0.0% 0.0% 0.0% 0.0% 29.9% CANOE COST OF GOODS SEPT/OCT/NOV "ISO" Revenues Account Description SEPTEMBER OCTOBER AVERAGE OF SEPT/OCT/NOV NOVEMBER 4200-0401 Food Sales 12310 14768 15744 Food Sales 20,153 $ 6200-0401 Food Cost of Goods 6886 7318 8004 Food Cost of Goods 9,809 $ Gross Margin 5424 7450 7739 Gross Margin 10,344 $ COGS> 55.9% 49.6% 51.4% COGS 48.7% 4220-0401 Draught Sales Draught Sales 6220-0401 Draught Cost of Goods Draught Cost of Goods Gross Margin Gross Margin 4240-0401 Bottled Beer Sales 347 557 521 Bottled Beer Sales 659 $ 6240-0401 Bottled Beer Cost of Goods 132 186 185 Bottled Beer Cost of Goods 238 $ Gross Margin 215 371 336 Gross Margin 421 $ 38.0% 33.4% 35.8% COGS 36.1% 4260-0401 Liquor Sales 20 92 67 $ Liquor Sales 90 $ 6260-0401 Liquor Cost of Goods 198 51 83 $ Liquor Cost of Goods
Gross Margin
41 (16) $ Gross Margin 90 $ 990.0% 55.4% 348.5% COGS 0.0% 4270-0401 Wine Sales Wine Sales 6270-0401 Wine Cost of Goods Wine Cost of Goods Gross Margin Gross Margin 4280-0401 Miscellaneous Sales 5 37 Miscellaneous Sales 17 $ 6280-0401 Miscellaneous Cost of Goods
Miscellaneous Cost of Goods
Gross Margin 5 39.4 Gross Margin 17 $ 4290-0401 Pop-Juice Sales 1510 1866 1,949 $ Pop-Juice Sales 2,471 $ 6290-0401 Pop-Juice Cost of Goods 322 149 273 $ Pop-Juice Cost of Goods 347 $ Gross Margin 1188 1717 1,676 $ Gross Margin 2,124 $
COGS 21.3% 7.98% 14.5% COGS* 14.0% Canoe Total Sales 14192 17320 18301 Canoe Total Sales 23,390 $ Canoe Total Cost of Goods 7538 7701.6 8544 Canoe Total Cost of Goods 10,394 $ Canoe Gross Margin 6654 9618.4 9756 Canoe Gross Margin 12,996 $ Canoe Gross Margin % 47% 56% 53% Canoe Gross Margin % 56% COGS> 53.1% 44.5% 47.3% COGS 44.4%
COGS %
Revenues Account Description April May June July August September October November December January February March Total April - Sept 4200-0402 Food Sales 9,497 $ 8,031 $ 6,938 $ 2,456 $ 2,698 $ 9,135 $ 9,457 $ 7,744 $ 3,500 $ 17,382 $ 8,429 $ 37,055 $ 122,322 $ 38755 6200-0402 Food Cost of Goods 1,451 $ 1,100 $ 1,158 $ 525 $ 270 $ 3,684 $ 2,847 $ 3,328 $ 14,363 $ 8188 Gross Margin 8,046 $ 6,931 $ 5,780 $ 1,931 $ 2,428 $ 5,451 $ 6,610 $ 4,416 $ 3,500 $ 17,382 $ 8,429 $ 37,055 $ 107,959 $ COGS 15.3% 13.7% 16.7% 21.4% 10.0% 40.3% 30.1% 43.0% 0.0% 0.0% 0.0% 0.0% 11.7% 21.1% 4290-0402 Pop-Juice Sales 448 $ 1,185 $ 594 $ 1,320 $ 886 $ 796 $ 5,229 $ 3547 6290-0402 Pop-Juice Cost of Goods 214 $ 155 $ 219 $ 155 $ 430 $ 554 $ 488 $ 523 $ 2,738 $ 1727 Gross Margin (214) $ (155) $ 229 $ 1,030 $ 164 $ 766 $ 398 $ 273 $
2,491 $ COGS #DIV/0! #DIV/0! 48.88% 13.08% 72.39% 41.97% 55.08% 65.7% #DIV/0! #DIV/0! #DIV/0! #DIV/0! 52.4% 48.7% 4300-0402 Coffee Sales 1,625 $ 3,634 $ 1,275 $ 3,008 $ 2,818 $ 2,643 $ 15,003 $ 9542 6300-0402 Coffee Cost of Goods 612 $ 631 $ 426 $ 588 $ 543 $ 1,818 $ 777 $ 1,263 $ 6,658 $ 4618 Gross Margin (612) $ (631) $ 1,199 $ 3,046 $ 732 $ 1,190 $ 2,041 $ 1,380 $
8,345 $ COGS #DIV/0! #DIV/0! 26.2% 16.2% 42.6% 60.4% 27.6% 47.8% #DIV/0! #DIV/0! #DIV/0! #DIV/0! 44.4% 48.4% 4310-0402 Speciality Coffee Sales 2,088 $ 8,769 $ 9,756 $ 10,200 $ 30,813 $ 10857 6310-0402 Specialty Coffee Cost of Goods 869 $ 446 $ 757 $ 871 $ 833 $ 3,619 $ 3,128 $ 3,661 $ 14,184 $ 7395 Gross Margin (869) $ (446) $ (757) $ (871) $ 1,255 $ 5,150 $ 6,628 $ 6,539 $
16,629 $ COGS #DIV/0! #DIV/0! #DIV/0! #DIV/0! 39.9% 41.3% 32.1% 35.9% #DIV/0! #DIV/0! #DIV/0! #DIV/0! 46.0% 68.1% 4320-0402 Tea Sales 555 $ 3,710 $ 4,844 $ 4,686 $ 13,795 $ 4265 6320-0402 Tea Cost of Goods 146 $ 119 $ 154 $ 116 $ 62 $ 421 $ 182 $ 360 $ 1,560 $ 1018 Gross Margin (146) $ (119) $ (154) $ (116) $ 493 $ 3,289 $ 4,662 $ 4,326 $
12,235 $ COGS #DIV/0! #DIV/0! #DIV/0! #DIV/0! 11.2% 11.3% 3.8% 7.7% #DIV/0! #DIV/0! #DIV/0! #DIV/0! 11.3% 23.9% 4250-0402 Smoothie/Specialty Juice/Shakes Sales 588 $ 2,648 $ 1,650 $ 783 $ 5,669 $ 3236 6250-0402 Smoothie/Specialty Juice/Shakes Cost 82 $ 56 $ 316 $ 368 $ 197 $ 877 $ 186 $ 301 $ 2,383 $ 1896 Gross Margin (82) $ (56) $ (316) $ (368) $ 391 $ 1,771 $ 1,464 $ 482 $
3,286 $ COGS #DIV/0! #DIV/0! #DIV/0! #DIV/0! 33.5% 33.1% 11.3% 38.4% #DIV/0! #DIV/0! #DIV/0! #DIV/0! 42.0% 58.6% 4280-0402 Miscellaneous Sales 25 $ 1 $ 8 $ 11 $ 45 $ 6280-0402 Miscellaneous Cost of Goods
Gross Margin
25 $
1 $
8 $ 11 $
45 $ COGS #DIV/0! #DIV/0! 0.0% #DIV/0! 0.0% #DIV/0! 0.0% 0.0% #DIV/0! #DIV/0! #DIV/0! #DIV/0! Fairgrounds Total Sales 9,497 $ 8,031 $ 9,036 $ 7,275 $ 7,799 $ 28,590 $ 29,419 $ 26,863 $ 3,500 $ 17,382 $ 8,429 $ 37,055 $ 192,876 $ 70228 Fairgrounds Total Cost of Goods 3,374 $ 2,507 $ 3,030 $ 2,623 $ 2,335 $ 10,973 $ 7,608 $ 9,436 $
41,886 $ 24842 Fairgrounds Gross Margin 6,123 $ 5,524 $ 6,006 $ 4,652 $ 5,464 $ 17,617 $ 21,811 $ 17,427 $ 3,500 $ 17,382 $ 8,429 $ 37,055 $ 150,990 $ Fairgrounds Gross Margin % 64.5% 68.8% 66.5% 63.9% 70.1% 61.6% 74.1% 64.9% 100.0% 100.0% 100.0% 100.0% 78.3% 35.4% COGS 35.5% 31.2% 33.5% 36.1% 29.9% 38.4% 25.9% 35.1% 0.0% 0.0% 0.0% 0.0% 21.7% FAIRGROUNDS COST OF GOOD SEPT/OCT/NOV "ISO" Revenues Account Description SEPTEMBER OCTOBER AVERAGE OF SEPT/OCT/NOV NOVEMBER Revenues Account Description September October November 4200-0402 Food Sales 9,135 $ 9,457 $ 8,779 $ Food Sales 7,744 $ 6200-0402 Food Cost of Goods 3,684 $ 2,847 $ 3,286 $ Food Cost of Goods 3,328 $ Gross Margin 5,451 $ 6,610 $ 5,492 $ Gross Margin 4,416 $ COGS 40.3% 30.1% 35.2% COGS 43.0% 4290-0402 Pop-Juice Sales 1,320 $ 886 $ 1,001 $ Pop-Juice Sales 796 $ 6290-0402 Pop-Juice Cost of Goods 554 $ 488 $ 522 $ Pop-Juice Cost of Goods 523 $ Gross Margin 766 $ 398 $ 479 $ Gross Margin 273 $ COGS 42.0% 55.1% 48.5% COGS 65.7% 4300-0402 Coffee Sales 3,008 $ 2,818 $ 2,363 $ Coffee Sales 1,263 $ 6300-0402 Coffee Cost of Goods 1,818 $ 777 $ 1,124 $ Coffee Cost of Goods 777 $ Gross Margin 1,190 $ 2,041 $ 1,239 $ Gross Margin 486 $ COGS 60.4% 27.6% 44.0% COGS 61.5% 4310-0402 Speciality Coffee Sales 8,769 $ 9,756 $ 9,575 $ Speciality Coffee Sales 10,200 $ 6310-0402 Specialty Coffee Cost of Goods 3,619 $ 3,128 $ 3,469 $ Specialty Coffee Cost of Goo 3,661 $ Gross Margin 5,150 $ 6,628 $ 6,106 $ Gross Margin 6,539 $ COGS 41.3% 32.1% 36.7% COGS 35.9%
4320-0402 Tea Sales 3,710 $ 4,361 $ 4,252 $ Tea Sales 4,686 $ 6320-0402 Tea Cost of Goods 421 $ (184) $ 199 $ Tea Cost of Goods 360 $ Gross Margin 3,289 $ 4,545 $ 4,053 $ Gross Margin 4,326 $ COGS 11.3%
3.6% COGS 7.7% 4250-0402 Smoothie/Specialty Juice/Shakes Sale 2,648 $ 1,650 $ 1,694 $ Smoothie/Specialty Juice/Sh 783 $ 6250-0402 Smoothie/Specialty Juice/Shakes Cost 877 $ 186 $ 455 $ Smoothie/Specialty Juice/Sh 301 $ Gross Margin 1,771 $ 1,464 $ 1,239 $ Gross Margin 482 $ COGS 33.1% 11.3% 22.2% COGS 38.4% 4280-0402 Miscellaneous Sales 7.8 $ 6.2 $ Miscellaneous Sales 10.8 $ 6280-0402 Miscellaneous Cost of Goods
Miscellaneous Cost of Goods Gross Margin
7.8 $ 6.2 $ Gross Margin 10.8 $ COGS COGS Fairgrounds Total Sales 28,590 $ 28,936 $ 27,670 $ Fairgrounds Total Sales 25,483 $ Fairgrounds Total Cost of Goods 10,973 $ 7,242 $ 9,055 $ Fairgrounds Total Cost of Go 8,950 $ Fairgrounds Gross Margin 17,617 $ 21,694 $ 18,615 $ Fairgrounds Gross Margin 16,533 $ Fairgrounds Gross Margin % 61.6% 75.0% 68.3% Fairgrounds Gross Margin % 64.9% COGS 38.4% 25.0% 32.7% 35.1%
Trend Analysis
2016-17 Gross Sales Flunctuations (Real Est.) Gross sales increase or decrease (percentage) for each month from November - March when compared to October. The trending of these changes will be applied to projected Total Sales (only food and liquor sales were reported in 2016-17 for the Canoe) for Nov - March 2017/2018 and distributed according to Sept-Oct 2017 sales mix. 2016 2016 2016 2017 2017 2017 Description October November % inc/dec December % inc/dec January % inc/dec February % inc/dec March % inc/dec total gross sales 19,866 $ 22,811 $ 114.8% 3,513 $ 17.7% 15,575 $ 78.4% 10,833 $ 54.5% 22,348 $ 112.5% 2017-18 Trend Projections Based on 2016-17 Gross Sales Flunctuations (Real Est.) Application of 2016-17 sales flunctuations by month using October 2017 as the base. Projections 2017 2017 2017 2018 2018 2018 Description October November December % inc/dec January % inc/dec February % inc/dec March % inc/dec total gross sales 17,322 $ 23,390 $ 3,066 $ 17.7% 13,580 $ 78.4% 9,440 $ 54.5% 19,487 $ 112.5%
Trend Analysis
2016-17 Gross Sales Flunctuations (Real Est.) Gross sales increase or decrease (percentage) for each month from November - March when compared to October. The trending of these changes will be applied to projected Total Sales (only food sales were reported in 2016-17 for Fairgrounds) for Nov - March 2017/2018 and distributed according to Sept-Oct 2017 sales mix. 2016 2016 2016 2017 2017 2017 Description October November % inc/dec December % inc/dec January % inc/dec February % inc/dec March % inc/dec total gross sales 18420 19915 108.1% 3500 19.0% 17382 94.4% 8429 45.8% 37055 201.2% 2017-18 Trend Projections Based on 2016-17 Gross Sales Flunctuations (Real Est.) Application of 2016-17 sales flunctuations by month using October 2017 as the base. Projections 2017 2017 2017 2018 2018 2018 Description October November December % inc/dec January % inc/dec February % inc/dec March % inc/dec total gross sales 29,419 $ 26,862 $ 5,590 $ 19.0% 27,772 $ 94.4% 13,474 $ 45.8% 59,191 $ 201.2%
CANOE Forecast Gross Sales
Projections 2017 2017 2017 2018 2018 2018 October November December % inc/dec January % inc/dec February % inc/dec March % inc/dec 17,322 $ 23,390 $ 3,066 $ 17.7% 13,580 $ 78.4% 9,440 $ 54.5% 19,487 $ 112.5%
CANOE Sales Mix Analysis
SEPT/OCT/NOV "ISO" SEPTEMBER OCTOBER AVERAGE OF SEPT/OCT/NOV November Account Description September % Sales Mix Account Description October % Sales Mix Account Description October % Sales Mix 4200-0401 Food Sales 12,310 $ 86.7% 4200-0401 Food Sales 14768 85.3% 86.1% Food Sales 4200-0401 Food Sales 20153 86.2% 4220-0401 Draught Sales 0.0% 4220-0401 Draught Sales 0.0% 0.0% Draught Sales 4220-0401 Draught Sales 0.0% 4240-0401 Bottled Beer Sales 347 $ 2.4% 4240-0401 Bottled Beer Sales 557 3.2% 2.8% Bottled Beer Sales 4240-0401 Bottled Beer Sales 659 2.8% 4260-0401 Liquor Sales 20 $ 0.1% 4260-0401 Liquor Sales 92 0.5% 0.4% Liquor Sales 4260-0401 Liquor Sales 90 0.4% 4270-0401 Wine Sales 0.0% 4270-0401 Wine Sales 0.0% 0.0% Wine Sales 4270-0401 Wine Sales 0.0% 4280-0401 Miscellaneous Sales 5 $ 0.0% 4280-0401 Miscellaneous Sales 37 0.2% 0.1% Miscellaneous Sales 4280-0401 Miscellaneous Sales 17 0.1% 4290-0401 Pop-Juice Sales 1,510 $ 10.6% 4290-0401 Pop-Juice Sales 1868 10.8% 10.7% Pop-Juice Sales 4290-0401 Pop-Juice Sales 2471 10.6% Canoe Total Sales 14,192 $ 100.0% Canoe Total Sales 17,322 $ 100.0% 100.0% Canoe Total Sales 23,390 $ 100.0% CANOE COST OF GOODS SEPT/OCT/NOV "ISO" Revenues Account Description SEPTEMBER OCTOBER AVERAGE OF SEPT/OCT/NOV NOVEMBER 4200-0401 Food Sales 12310 14768 15744 Food Sales 20,153 $ 6200-0401 Food Cost of Goods 6886 7318 8004 Food Cost of Goods 9,809 $ Gross Margin 5424 7450 7739 Gross Margin 10,344 $ COGS> 55.9% 49.6% 51.4% COGS 48.7% 4220-0401 Draught Sales Draught Sales 6220-0401 Draught Cost of Goods Draught Cost of Goods Gross Margin Gross Margin 4240-0401 Bottled Beer Sales 347 557 521 Bottled Beer Sales 659 $ 6240-0401 Bottled Beer Cost of Goods 132 186 185 Bottled Beer Cost of Goods 238 $ Gross Margin 215 371 336 Gross Margin 421 $ 38.0% 33.4% 35.8% COGS 36.1% 4260-0401 Liquor Sales 20 92 67 $ Liquor Sales 90 $ 6260-0401 Liquor Cost of Goods 198 51 83 $ Liquor Cost of Goods
Gross Margin
41 (16) $ Gross Margin 90 $ 990.0% 55.4% 348.5% COGS 0.0% 4270-0401 Wine Sales Wine Sales 6270-0401 Wine Cost of Goods Wine Cost of Goods Gross Margin Gross Margin 4280-0401 Miscellaneous Sales 5 37 Miscellaneous Sales 17 $ 6280-0401 Miscellaneous Cost of Goods
Miscellaneous Cost of Goods
Gross Margin 5 39.4 Gross Margin 17 $ 4290-0401 Pop-Juice Sales 1510 1866 1,949 $ Pop-Juice Sales 2,471 $ 6290-0401 Pop-Juice Cost of Goods 322 149 273 $ Pop-Juice Cost of Goods 347 $ Gross Margin 1188 1717 1,676 $ Gross Margin 2,124 $ COGS 21.3% 7.98% 14.5% COGS* 14.0% Canoe Total Sales 14192 17320 18301 Canoe Total Sales 23,390 $ Canoe Total Cost of Goods 7538 7701.6 8544 Canoe Total Cost of Goods 10,394 $ Canoe Gross Margin 6654 9618.4 9756 Canoe Gross Margin 12,996 $ Canoe Gross Margin % 47% 56% 53% Canoe Gross Margin % 56% COGS> 53.1% 44.5% 47.3% COGS 44.4% Description April May June July August September October November December January February March Total Food Sales 5,784 $ 3,260 $ 5,182 $ 6,024 $ 1,917 $ 12,310 $ 14,768 $ 20,153 $ 2,638 $ 11,686 $ 8,123 $ 16,769 $ 108,614 $ Food Cost of Goods 2,657 $ 2,546 $ 2,656 $ 2,100 $ 2,249 $ 6,886 $ 7,318 $ 9,809 $ 1,356 $ 6,005 $ 4,174 $ 8,617 $ 56,373 $ Gross Margin 3,127 $ 714 $ 2,526 $ 3,924 $ (332) $ 5,424 $ 7,450 $ 10,344 $ 1,283 $ 5,681 $ 3,949 $ 8,152 $ 52,241 $ COGS> 46% 78% 51% 35% 117% 56% 50% 49% 51% 51% 51% 51% 52% Draught Sales
Draught Cost of Goods 27 $ 273 $ 300 $ Gross Margin
$ (273) $
(300) $
Bottled Beer Sales 48 $ 37 $ 94 $ 347 $ 557 $ 659 $ 87 $ 384 $ 267 $ 551 $ 3,030 $ Bottled Beer Cost of Goods 26 $ 11 $ 24 $ (10) $ 47 $ 132 $ 186 $ 238 $ 31 $ 138 $ 96 $ 197 $ 1,115 $ Gross Margin 26
47 47 215 371 422 56 246 171 353 1,915 COGS> #DIV/0! #DIV/0! 50.0%
50.0% 38.0% 33.4% 36.1% 35.8% 35.8% 35.8% 35.8% 36.8% Liquor Sales 471 $ 125 $ 124 $ 10 $ 4 $ 20 $ 92 $ 90 $ 11 $ 48 $ 33 $ 69 $ 1,097 $ Liquor Cost of Goods 13 $ 9 $ (72) $ 198 $ 51 $
6 $ 27 $ 18 $ 38 $ 288 $ Gross Margin 458 $ 116 $ 124 $ 10 $ 76 $ (178) $ 41 $ 90 $ 5 $ 21 $ 15 $ 31 $ 808 $ Wine Sales
Wine Cost of Goods
Gross Margin
180 $ 2 $ 7 $ 9 $ 5 $ 37 $ 17 $ 3 $ 15 $ 10 $ 21 $ 305 $ Miscellaneous Cost of Goods (2) $
(2) $ Gross Margin
180 $ 2 $ 7 $ 9 $ 5 $ 39 $ 17 $ 3 $ 15 $ 10 $ 21 $ 308 $ Pop-Juice Sales 205 $ 387 $ 290 $ 1,510 $ 1,866 $ 2,471 $ 327 $ 1,448 $ 1,007 $ 2,078 $ 11,588 $ Pop-Juice Cost of Goods 107 $ 176 $ 133 $ 114 $ 511 $ 322 $ 149 $ 347 $ 47 $ 209 $ 145 $ 300 $ 2,561 $ Gross Margin (107) $ (176) $ 72 $ 273 $ (221) $ 1,188 $ 1,717 $ 2,124 $ 280 $ 1,239 $ 861 $ 1,778 $ 9,027 $ COGS> #DIV/0! #DIV/0! 64.9% 29.5% 176.2% 21.3% 8.0% 14.0% 14.5% 14.5% 14.5% 14.5% 22.1% Canoe Total Sales 6,255 $ 3,565 $ 5,561 $ 6,465 $ 2,314 $ 14,192 $ 17,320 $ 23,390 $ 3,066 $ 13,580 $ 9,440 $ 19,487 $ 124,635 $ Canoe Total Cost of Goods 2,803 $ 2,769 $ 3,086 $ 2,204 $ 2,735 $ 7,538 $ 7,701 $ 10,394 $ 1,440 $ 6,378 $ 4,434 $ 9,153 $ 60,635 $ Canoe Gross Margin 3,452 $ 796 $ 2,475 $ 4,261 $ (421) $ 6,654 $ 9,619 $ 12,997 $ 1,626 $ 7,202 $ 5,006 $ 10,334 $ 63,999 $ Canoe Gross Margin % 55.2% 22.3% 44.5% 65.9%
46.9% 55.5% 55.6% 53.0% 53.0% 53.0% 53.0% 51.3% COGS> 45% 78% 55% 34% 118% 53% 44% 44% 47% 47% 47% 47% 49%
FAIRGROUNDS Forecast Gross Sales
Application of 2016-17 sales flunctuations by month using October 2017 as the base. Projections 2017 2017 2017 2018 2018 2018 Description October November December % inc/dec January % inc/dec February % inc/dec March % inc/dec total gross sales 29,419 $ 26,862 $ 5,590 $ 19.0% 27,772 $ 94.4% 13,474 $ 45.8% 59,191 $ 201.2%
FAIRGROUNDS Sales Mix Analysis
SEPT/OCT/NOV "ISO" SALES MIX SEPTEMBER OCTOBER COMBINED November Account Description September % Sales Mix Account 4200-0402 Food Sales 9,135 $ 32.0% 4200-0402 Food Sales 9,457 $ 32.1% 31.0% Food Sales Food Sales 7744 28.8% 4290-0402 Pop-Juice Sales 1,320 $ 4.6% 4290-0402 Pop-Juice Sales 886 $ 3.0% 3.5% Pop-Juice Sales Pop-Juice Sales 796 3.0% 4300-0402 Coffee Sales 3,008 $ 10.5% 4300-0402 Coffee Sales 2,818 $ 9.6% 10.0% Coffee Sales Coffee Sales 2643 9.8% 4310-0402 Speciality Coffee Sales 8,769 $ 30.7% 4310-0402 Speciality Coffee Sales 9,756 $ 33.2% 33.9% Speciality Coffee Sales Speciality Coffee 10200 38.0% 4320-0402 Tea Sales 3,710 $ 13.0% 4320-0402 Tea Sales 4,844 $ 16.5% 15.6% Tea Sales Tea Sales 4686 17.4% 4250-0402 Smoothie etc. 2,648 $ 9.3% 4250-0402 Smoothie etc. 1,650 $ 5.6% 5.9% Smoothie etc. Smoothie etc. 783 2.9% 4280-0402 Miscellaneous Sales 4280-0402 Miscellaneous Sales 8 $ 0.0% 0.0% Miscellaneous Sales Miscellaneous S 11 0.0% 100.0% 100.0% 100.0% Canoe Total Sales 28,590 $ 29,419 $ 26,863 $
FAIRGROUNDS COST OF GOODS
FAIRGROUNDS COST OF GOOD SEPT/OCT/NOV "ISO" Revenues Account Description SEPTEMBER OCTOBER AVERAGE OF SEPT/OCT/NOV NOVEMBER Revenues Account Description September October November 4200-0402 Food Sales 9,135 $ 9,457 $ 8,779 $ Food Sales 7,744 $ 6200-0402 Food Cost of Goods 3,684 $ 2,847 $ 3,286 $ Food Cost of Goods 3,328 $ Gross Margin 5,451 $ 6,610 $ 5,492 $ Gross Margin 4,416 $ COGS 40.3% 30.1% 35.2% COGS 43.0% 4290-0402 Pop-Juice Sales 1,320 $ 886 $ 1,001 $ Pop-Juice Sales 796 $ 6290-0402 Pop-Juice Cost of Goods 554 $ 488 $ 522 $ Pop-Juice Cost of Goods 523 $ Gross Margin 766 $ 398 $ 479 $ Gross Margin 273 $ COGS 42.0% 55.1% 48.5% COGS 65.7% 4300-0402 Coffee Sales 3,008 $ 2,818 $ 2,363 $ Coffee Sales 1,263 $ 6300-0402 Coffee Cost of Goods 1,818 $ 777 $ 1,124 $ Coffee Cost of Goods 777 $ Gross Margin 1,190 $ 2,041 $ 1,239 $ Gross Margin 486 $
COGS 60.4% 27.6% 44.0% COGS 61.5% 4310-0402 Speciality Coffee Sales 8,769 $ 9,756 $ 9,575 $ Speciality Coffee Sales 10,200 $ 6310-0402 Specialty Coffee Cost of Goods 3,619 $ 3,128 $ 3,469 $ Specialty Coffee Cost of Goo 3,661 $ Gross Margin 5,150 $ 6,628 $ 6,106 $ Gross Margin 6,539 $ COGS 41.3% 32.1% 36.7% COGS 35.9% 4320-0402 Tea Sales 3,710 $ 4,361 $ 4,252 $ Tea Sales 4,686 $ 6320-0402 Tea Cost of Goods 421 $ (184) $ 199 $ Tea Cost of Goods 360 $ Gross Margin 3,289 $ 4,545 $ 4,053 $ Gross Margin 4,326 $ COGS 11.3%
3.6% COGS 7.7% 4250-0402 Smoothie/Specialty Juice/Shakes Sale 2,648 $ 1,650 $ 1,694 $ Smoothie/Specialty Juice/Sh 783 $ 6250-0402 Smoothie/Specialty Juice/Shakes Cost 877 $ 186 $ 455 $ Smoothie/Specialty Juice/Sh 301 $ Gross Margin 1,771 $ 1,464 $ 1,239 $ Gross Margin 482 $ COGS 33.1% 11.3% 22.2% COGS 38.4% 4280-0402 Miscellaneous Sales 7.8 $ 6.2 $ Miscellaneous Sales 10.8 $ 6280-0402 Miscellaneous Cost of Goods
Miscellaneous Cost of Goods Gross Margin
7.8 $ 6.2 $ Gross Margin 10.8 $ COGS COGS Fairgrounds Total Sales 28,590 $ 28,936 $ 27,670 $ Fairgrounds Total Sales 25,483 $ Fairgrounds Total Cost of Goods 10,973 $ 7,242 $ 9,055 $ Fairgrounds Total Cost of Go 8,950 $ Fairgrounds Gross Margin 17,617 $ 21,694 $ 18,615 $ Fairgrounds Gross Margin 16,533 $ Fairgrounds Gross Margin % 61.6% 75.0% 68.3% Fairgrounds Gross Margin % 64.9% COGS 38.4% 25.0% 32.7% 35.1%
Fairgrounds (0402)
Description April May June July August September October November December January February March Total Food Sales Food Sales 9,497 $ 8,031 $ 6,938 $ 2,456 $ 2,698 $ 9,135 $ 9,457 $ 7,744 $ 1,731 $ 8,602 $ 4,174 $ 18,334 $ 88,798 $ Food Cost of Goods Food Cost of Goods 1,451 $ 1,100 $ 1,158 $ 525 $ 270 $ 3,684 $ 2,847 $ 3,328 $ 610 $ 3,029 $ 1,470 $ 6,457 $ 25,929 $ Gross Margin Gross Margin 8,046 6,931 5,780 1,931 2,428 5,451 6,610 4,416 1,122 5,573 2,704 11,878 62,869 COGS> COGS> 15.3% 13.7% 16.7% 21.4% 10.0% 40.3% 30.1% 43.0% 35.2% 35.2% 35.2% 35.2% 29.2% Pop-Juice Sales Pop-Juice Sales 448 1,185 594 1,320 886 796 197 981 476 2,090 8,972 Pop-Juice Cost of Goods Pop-Juice Cost of Goods 214 155 219 155 430 554 488 523 96 476 231 1,014 4,554 Gross Margin Gross Margin 214
1,030 164 766 398 273 102 505 245 1,076 4,418 COGS> COGS> #DIV/0! #DIV/0! 48.9% 13.1% 72.4% 42.0% 55.1% 65.7% 48.5% 48.5% 48.5% 48.5% 50.8% Coffee Sales Coffee Sales 1,625 3,634 1,275 3,008 2,818 2,642 558 2,771 1,345 5,907 25,583 Coffee Cost of Goods Coffee Cost of Goods 612 631 426 588 543 1,818 777 777 245 1,220 592 2,599 10,828 Gross Margin Gross Margin 612
3,046 732 1,190 2,041 1,865 312 1,552 753 3,308 14,755 COGS> COGS> #DIV/0! #DIV/0! 26.2% 16.2% 42.6% 60.4% 27.6% 29.4% 44.0% 44.0% 44.0% 44.0% 42.3% Speciality Coffee Sales Speciality Coffee Sales 2,088 8,769 9,756 10,200 1,897 9,424 4,572 20,086 66,793 Specialty Coffee Cost of Goods Specialty Coffee Cost of Goods 869 446 757 871 833 3,619 3,128 3,661 695 3,456 1,677 7,365 27,376 Gross Margin Gross Margin 869
5,150 6,628 6,539 1,201 5,969 2,896 12,721 39,416 Tea Sales Tea Sales 555 3,710 4,844 4,686 874 4,340 2,106 9,251 30,366 Tea Cost of Goods Tea Cost of Goods 146 119 154 116 62 421 181 539 31 155 75 330 2,329 Gross Margin Gross Margin 146
3,289 4,663 4,147 842 4,186 2,031 8,921 28,037 COGS> COGS> #DIV/0! #DIV/0! #DIV/0! #DIV/0! 11.2% 11.3% 3.7% 11.5% 3.6% 3.6% 3.6% 3.6% 7.7% Smoothie/Specialty Juice/Shakes Sales Smoothie/Specialty Juice/Shakes Sales 588 2,648 1,650 783 331 1,646 799 3,509 11,955 Smoothie/Specialty Juice/Shakes Cost of Goods Smoothie/Specialty Juice/Shakes Co 82 56 316 368 197 877 186 301 74 365 177 779 3,778 Gross Margin Gross Margin 82
1,771 1,464 482 258 1,281 621 2,730 8,177 COGS> COGS> #DIV/0! #DIV/0! #DIV/0! #DIV/0! 33.5% 33.1% 11.3% 38.4% 22.2% 22.2% 22.2% 22.2% 31.6% Miscellaneous Sales Miscellaneous Sales 25 1 8 11 45 Miscellaneous Cost of Goods Miscellaneous Cost of Goods
Gross Margin
11
Fairgrounds Total Sales Fairgrounds Total Sales 9,497 8,031 9,036 7,275 7,799 28,590 29,419 26,862 5,588 27,765 13,471 59,178 232,510 Fairgrounds Total Cost of Goods Fairgrounds Total Cost of Goods 3,374 2,507 3,030 2,623 2,335 10,973 7,607 9,129 1,751 8,700 4,221 18,544 74,794 Fairgrounds Gross Margin Fairgrounds Gross Margin 6,123 5,524 6,006 4,652 5,464 17,617 21,812 17,733 3,837 19,065 9,250 40,634 157,716 Fairgrounds Gross Margin % Fairgrounds Gross Margin % 1 1 1 1 1 1 1 1 1 1 1 1 1 COGS> COGS> 35.5% 31.2% 33.5% 36.1% 29.9% 38.4% 25.9% 34.0% 31.3% 31.3% 31.3% 31.3% 32.2%
STAFF COST - CANOE
November Operating Days> 21 Total PT Staff Wages - November 18,623 $ * Average Staff Cost per Day> 887 $ ASC/D plus 10%> 975 $ * note that this month contained three payroll payments, probably a timing issue. Each of the three payroll payments were essentially the same, that being $5700. November Re-calculation for estimation of payroll cost of Canoe for remainder of fiscal year. The December amount will be
calculated as half the monthly estimate below. November Operating Days> 21 Total PT Staff Wages - November 11,400 $ Average Staff Cost per Day> 543 $ ASC/D plus 10%> 597 $ December January February March # of operating days> 13 21 19 22 total staff cost> 7,762.86 $ 12,540 $ 11,346 $ 13,137 $ % of benefits/staff cost total> 442 $ 715 $ 647 $ 749 $
reduce turnover and to attract more staff applicants - often had to shut down operations or limit hours due to lack of staff.
STAFF COST - FAIRGROUNDS
Canoe staff costs will be estimated based the the cost per operating in October plus a 10% buffer. Remaining months will be calculated using the October estimate multiplied by operating days. October Operating Days> 21 Total PT Staff Wages - October 6,748 $ Average Staff Cost per Day> 321 $ ASC/D plus 10%> 353 $ November Operating Days> 21 Total PT Staff Wages - November 11,526 $ * Average Staff Cost per Day> 549 $ ASC/D plus 10%> 604 $ * note that this month contained three payroll payments, probably a timing issue. Each of the three payroll payments were essentially the same, that being $5700. November Re-calculation for estimation of payroll cost of Canoe for remainder of fiscal year. The December amount will be calculated as half the monthly estimate below. November Operating Days> 21 Total PT Staff Wages - November 7,772 $ Average Staff Cost per Day> 370 $ ASC/D plus 10%> 407 $ December January February March # of operating days> 13 21 19 22 total staff cost> 5,292 $ 7,423 $ 6,716 $ 7,776 $ % of benefits/staff cost total> 302 $ 423 $ 383 $ 443 $
5080-0403 Licenses, Dues, Certificates 2016-17 Budget Notes
520.00 $
2017-18 Budget Notes
per year 82.50 $ amortized monthly 6.88 $ 5090-0403 Cash Over/Short 2016-17 Budget Notes $240 2017-18 Budget Notes $240
5100-0401 Postage & Courier 2016-17 Budget Notes 2017-18 Budget Notes
78 $
5110-0401 Contracted Services There has been approx. $1200 to date. I am going to place a plug number of $100 per month to ensure some funds are available should it be required. 5130-0403 IT (software, hardware, tech support) 2016-17 Budget Notes
2017-18 Budget Notes Canoe Fairgrounds
195.12 $ 195.00 $
80.25 $ 26.75 $ 275.37 $ 221.75 $ contingency 50.00 $ 50.00 $ total 325.37 $ 271.75 $ 5140-0401 Operating Supplies
2016-17 Budget Notes Annual> 77,215 $ per month> 6,434.58 $ 2017-18 Budget Notes YTD = 9460 Monthly> 1,183 $ School Year (high volume) Months Sept October November average per month 2,899 $ 1,654 $ 2,017 $ 2,190 $ $2190 per month will be applied to remaining fiscal year months but December will be halved. 5149-0401 Office Supplies 2016-17 Budget Notes 98.00 $ 2017-18 Budget Notes 105 $ 15 $ 5150-0401 Equipment 2016-17 Budget Notes YTD> 3,408 $ Monthly> 284 $ 2017-18 Budget Notes YTD>
Monthly>
There is often a need for small equipment and small wares in restaurants. I am plugging $300 per month for the remaining months. 5180-0401 Equipment Lease/Rental 2016-17 Budget Notes YTD> 181.00 $ Monthly> 15 $ 2017-18 Budget Notes YTD>
Monthly>
Plug amount of $15 per month
5200-0401 Printing & Copying 2016-17 Budget Notes
The aggregated total for these printing costs not including Food Services was: 221.00 $ monthly> 18.42 $ SAGE acct. 5774 Printing and Copying - Food Services 2017-18 Budget Notes Plug figure of $15 per month. 5310-0401 Occupancy Charges Note: Because Canoe is a commercial space, its utility costs are not covered by the lease agreement. SUS is billed for hydro and gas separately metred for the the Canoe. 2016-17 Budget Notes
Annual> 6,884.00 $ Monthly> 573.67 $ 2017-18 Budget Notes
Annual> 6,994.14 $ Monthly> 582.85 $ YTD Utilities Charges: YTD Monthly Average Annual Projection based on YTD Revised Projection* Revised Monthly Projects - Nov - March Gas - April to October 3,948 $ 564 $ 6,769 $ 8,461 $ 705.08 $ Hydro - April to August 3,522 $ 503 $ 6,038 $ 7,547 $ 628.93 $ 1,067 $ 12,807 $ 16,008 $ 1,334.01 $ *The bulk of the current YTD actuals for Canoe facilities are based on a slow operating period - summer months. I have added 25% to the estimates for the remaining months as these months produce much higher volumes of food and beverage.
5315-0401 Repairs & Maintenance 2016-17 Budget Notes
2017-18 Budget Notes
monthly> 417 $ 5325-0401 Credit Card & Bank Charges 419 539 219 236 224 203 2017-18 Budget Notes YTD> 1,840 $ Monthly> 263 $ 5660-0401 Smallwares Plug amount of $50 per month for remainder of fiscal year. 5685-0401 Staff Discount - Food 2017-18 Budget Notes October is the only fully staff month of operation available in terms of providing data. In October, $191 was provided to staff. $190 will be plugged in for remaining months and half that amount at Christmas. 5690-0401 Spillage/Spoilage 2017-18 Budget Notes 27 626 153 221 258 YTD> 1,285 $ Monthly> 257 $
5090-0402 Cash Over/Short 16
9.11
17 2016-17 Budget Notes 2017-18 Budget Notes YTD> 23 $ Monthly> 4 $ 5100-0402 Postage & Courier 80 80 90 80 100 106 163 2017-18 Budget Notes YTD> 699 $ Monthly> 100 $ Note that most of these charges should be posted to contracted services in the coming fiscal year. 5110-0402 Contracted Services 2016-17 Budget Notes YTD> 4,326 $ Monthly> 361 $ 2017-18 Budget Notes Contracted Services - Garda $61 biweekly These fees have been posted to postage courier Last year's expenses per month plus Garda's fees will be reflected. $422 5130-0402 IT (software, hardware, tech support) 2017-18 Budget Notes Fairgrounds
195.00 $
26.75 $ 221.75 $ 5140-0402 Operating Supplies 2016-17 Budget Notes Annual> 17,941 $ Monthly> 1,495 $ 2017-18 Budget Notes
September October November Monthly Average 2,408.00 $ 2,826.00 $ 2,300.00 $ 2,511 $ 10% contingency 251 $ 2,762 $ This monthly average plus contingency will be applied to each month remaining in the fiscal year but December's total will be halved. 5150-0402 Equipment 2017-18 Budget Notes $150 per month will be budgeted for equipment 5310-0402 Occupancy Charges none are shown in the prior year
5315-0402 Repairs & Maintenance 2016-17 Budget Notes none shown 2017-18 Budget Notes $100 per month 5325-0402 Credit Card & Bank Charges 419 539 219 236 224 203 2017-18 Budget Notes YTD> 1,840 $ Monthly> 307 $ 5685-0402 Staff Discount - Food 167 290 386 445 2017-18 Budget Notes YTD> 1,288 $ Monthly> 322 $ 5690-0402 Spillage/Spoilage 1 79 332 137 2017-18 Budget Notes YTD> 549 $ Monthly> 137 $ $100 per month Promotion - Non-Alc. Bev 100 272 384 414 2017-18 Budget Notes YTD> 1,170 $ Monthly> 293 $
Department>
Revenues Account Description April May June July August September October November December January February March Total 4006-0500 FixIT Student Fee 15,031 5,406 5 43,987 6,199 38,698 5,876 115,202 4030-0500 Program Subsidy
Interest Income 77 76 77 95 99 89 77 76 77 95 99 89 1,026 4050-0500 Restricted Donations
Unrestricted Donations
Wage Subsidies
Miscellaneous
Ticket Sales 938 568 1,506 4110-0500 Sales Revenue 38 225 154 940 732 615 421 871 711 1,190 5,897 4120-0500 Tenant Rent/Lease
Commercial Lease Profit Sharing
Asset Disposal
1,015 15,675 5,521 325 253 45,016 809 6,890 498 39,664 6,686 1,279 123,631 Expenses 5000-0500 Full Time Salaries
Part Time Staff Costs 2,396 1,759
1,667 1,754 877 1,754 1,754 1,754 15,584 5030-0500 Full Time Benefits
Part Time Benefits 137 100
95 100 50 100 100 100 888 5080-0500 Licenses & Dues
Cash Over/Short
Postage & Courier
Contracted Services 5,257 5,257 5,257 5,257 5,257 5,157 5,257 5,257 5,257 5,257 5,257 5,257 62,984 5130-0500 IT Hardware/Software 1,044 156 147 186 142 1,200 1,200 3,019 1,097 101 1,084 1,051 10,427 5140-0500 Operating Supplies 253 253 5149-0500 Office Supplies
Small Equipment
Equipment Lease/Rental
Printing & Copying 52 20 14 11 4 17 48 48 48 48 48 48 408 5210-0500 Vehicle Op/Parking Pass
Conferences/Travel
Occupancy Charges
Credit Card & Bank Charges 25 25 5335-0500 Bad Debt
Amortization
Program Management
8,911 7,292 5,671 5,454 5,403 8,350 8,267 10,178 7,329 7,260 8,243 8,210 90,569 90,569 Surplus-Deficit 7,896
150
7,458
1,557
33,062 Department > FixIT 4040-0500 Interest Income Note: this line was missing from the budget template but existed on P and L accounts - added it to budget p and l 4100-500 Ticket Sales Note: this line was missing from the budget template but existed on P and L accounts - added it to budget p and l 5090-0500 Cash Over/Short
2016-17 Budget Notes
$82
2017-18 Budget Notes
$82 5120-0500 Hardware/Software
2016-17 Budget Notes
SAGE Acct. 5710 - FixIT Parts Supplies - Support Services indicates expenditures of: 11.2k
2017-18 Budget Notes
see budget sheet - first half from QB actuals, second half of year projected from SAGE account
Department>
Revenues Account Description April May June July August September October November December January February March Total 4000-0600 Student Union Society Membership Fees 105,642 38,003 35 298,363 44,021 262,484 41,629
4030-0600 Program Subsidy
Chequing & General Interest Income 909 912 1,076 1,156 1,288 849 844 814 794 965 9,607 4070-0600 Miscellaneous
Internal Operations Dept Revenue Transfer
38,915 1,111 1,156 299,651
844 263,298 42,423 965 799,784 799,784 Expenses 5110-0600 Contracted Services 517 517 517 9,643 517 517 517 517 517 517 24,517 517 39,330 5150-0500 Small Equipment 9,017 70 70 70 70 70 9,367 5310-0600 Occupancy Charges 105,000 105,000 5315-0600 Repairs & Maintenance 1,020
683 582 582 582 582 582 7,985 5320-0600 Insurance
Amortization
Loan Interest 28,929 27,935 31,801 27,808 28,668 28,605 27,922 27,730 26,700 29,100 29,000 26,635 340,833 Total Expenses 30,466 28,452 32,318 37,451 38,202 32,494 29,122 28,899 132,869 30,269 54,169 27,804 502,515 502,515 Surplus-Deficit 30,466
6,597 36,340
29,122
132,025
11,746
Accounts 4040-0100 Chequing & General Interest Income 2016-17 Budget Notes Revenues recorded under SAGE 4040 in Operating as Chequing and General Interest Income - Food Services were combined with Chequing and General Interest Income General Operation into QB Corporate Chequing and General Interest Income. Note the Feb. 2016 actual is very high - 4k - the GL must be checked. Revenues recorded under SAGE 4040 in Chequing and General Interest Income Services must be reviewed and if possible, separated into each of the earmarked Services - FixIt, Shuttle, UPASSE, H and D. If this cannot be done, the revenues will be estimated according to the ratio of the total funds in services to the funds of each service. 4050-0100 Restricted Donations 2016-17 Budget Notes These funds are likely to be Angel Tree donations. 2017-18 Budget Notes
4070-0100 Miscellaneous Income 2016-17 Budget Notes SAGE 4050 Miscellaneous Revenue - General Operations and Miscellaneous Revenue - Student Union Building and Miscellaneous Revenue - Support Services have been aggegated into QB Corporate Miscellaneous. These funds seem to be largely derived from locker rentals and photocopying fees and the two are often denoted "combined" rather than separately (hence difficult to accord to FixIT re. photocopying) and are not substantial funds. It would appear that these revenues were not posted appropriately each month hence a lump fee of $2776 appears at year end. SAGE 4050 Miscellaneous Revenue - Food Services need to be reviewed by Finance Manager and a determination made as to the items to be listed in either QB F and B Miscellaneous Revenue or QB Corporate Miscellaneous Revenues. NOTE: Examine Miscellaneous revenue GL as to the regular $22 fee (probably should be posted elsewhere) and the irregular and higher amounts from the 2016 actuals. 2017-18 Budget Notes There exists two "miscellaneous" revenue lines in corporate and I would suggest this is merged at the start of the new fiscal year. This account hold the following revenues:
4025-0100 Marketing (Advertising,Sponsorship etc.) 2016-17 Budget Notes There was an extraordinary revenue bump on January 18th, 2017 attributed to Eventbrite. This would seem to be a mispost as it is unlikely that Eventbrite bought a sponsorship. It is likely this are event funds gathered through Eventbrite in support of a major event: probably the Margaret Trudeau event. If true, these ticket sales should be moved to QB 4135-0100 SUB Equipment Rentals
2017-18 Budget Notes As equipment rental revenues were not separately recorded in the prior year's account year. To project sales based on the September and October actuals of 1.5k per month would be high risk. I have chosen to project revenues conservatively at $700 per month during high activity months and less than half of $700 - $300 - for low activity months. 4140-0100 ATM 2017-18 Budget Notes Projections are based on 2016-17 figures 4280-0100 Miscellaneous Sales 2017-18 Budget Notes
contained and they should be posted in this account.
5000-0100 Full Time Salaries 2016-17 Budget Notes 2017-18 Budget Notes
5110-0100 Contracted Services
FT salaries rather than in Food and Beverages. This salary is directly connected with three departments: Canoe, Fairgrounds, Catering Services. However, when reviewing the SUS budget and future financial reports - Profit and Loss statements and budgets - the Executive and Board should be aware and that this salary cost should be added manually to any estimation of the Food and Beverage Departments surplus/deficit.
is not a Facilities Manager nor Programmer. 5008-0100 SUS Staff/Exec Teambuilding 2016-17 Budget Notes
$4,023 2016-17 total> 4,023.00 $ monthly> 335.25 $ 2017-18 Budget Notes
QB expenditures will be applied for the first seven months. The monthly amount (see below) will be applied to remaining months. The aggregate will be "straight-line" estimated. 2017-18 Budget> 2,400.00 $ monthly> 200.00 $ Includes Exec transition, Christmas staff meeting, end of year staff appreciation. Pt Staff Christmas Party Food 622.00 $ gifts 307.00 $ 929.00 $ 5009-0100 Professional Development 2016-17 Budget Notes
$4548 for Squirrel training in "Food Services" and $1600 in "General Operations". 2016-17 total> 6,148.00 $ monthly> 512.33 $ 2017-18 Budget Notes Actual YTD - 2,772.00 $ Remaining from Budget>
2017-18 total> 3,622.00 $ 850.00 $ Remaining months> $200 alotments
$1,000 The expenditures for this training in the current fiscal year was assigned to Executive Team-building (5009) but should be moved in future budgets to this account. 5010-0100 Part Time Staff Costs 2016-17 Budget Notes
to part-time staff, not full-time staff (i.e. pension contributions). Hence, the "salaries" of the student Executive Committee members are shown in the QB Part-time Staff Costs.
reference to when some students held management positions in the Canoe. Note that SAGE also has specific accounts for Student Officers Wages Expenses, Content Editor Wages Expenses, and Finance Assistant Wages Expenses. These expenses have been all rolled into QB Corporate Part-time Staff Costs.
and expense reduction efforts.
In my opinion, this is an inappropriate use of the restricted - earmarked funds - collected from students via the SUB Building Fee $35. Restricted funds are to be used only for the purpose for which they were authorized. In my opinion, SUB funds should be used for the following purposes:
modernize the building and its spaces, and needed to support new SUS programming, event, and operating initiatives directly connected to expanding and improving the use of the SUB. I do not support the transfer of SUB restricted funds to cover part-time staff costs. While it is difficult to discern from the SAGE accounts, it is my belief that these staff costs are those of SUS office reception desk staff, and SUS facilities staff. These staff provide the following functions:
Most of these duties are more connected to the day to day operations of the SUS office, and its operations. It may be thought that logistical support for events may be considered a building cost but SUS recovers these variable costs through labour charges where these costs are substantive. Students have already paid charges students and external parties for for SUB space and equipment through the SUB fee and hence are not, unlike UFV and external groups, charged space rental or equipment rental fees. Variable costs are not In my opinion, variable labour costs, particularly given the staff are not dedicated to any specific, exclusively building cost, are not covered by the SUB fee. Should SUS have staff dedicated to custodial service of the staff, or painting the building, garbage disposal, building repair - in other words the services provided by UFV Facilities Management - then use of the SUB Fee to offset these costs would be appropriate. It is true that one could argue that on occasion, SUS PT staff probably do some work that could be construed to be "building specific", but in my opinion, that percentage would be extremely difficult to determine and to estimate a cost to be assigned to the SUB fee. This transfer of funds will not be carried out in the 2017-18 budget.
were paid from fees collected for Support Services i.e. Shuttle, UPASS, H and D, FixIT. There is no information as to how these costs were determined. My belief is that SUS part-time staff are largely carrying out tasks that by their nature are general and hence staff wages should be provided in Corporate from unrestricted SUS operating funds. One exception would be the part-time staff (2 students) hired to work in FixIT to assist the subcontracted manager of FixIT. Use of restricted funds collected for the FixIT can be applied to the part-time staff costs of FixIT as these are dedicated costs of providing the service; the students have no other function. The prior years tradition of the 19k transfer will not be carried in this or future annual budgets but FixIT staff costs will come from restricted funds collected for FixIT. 2017-18 Budget Notes Part-time staff cost forecasts will be predicated on actuals and trending of actuals entered into QB. The actuals of summer part time staff costs (2017) will be used to project for the following year and September/October 2017 actuals will be used to forecast the remainder of the year. As stated above, student Executives wages will be recorded in the part time staff QB Corporate department.
The part-time staff expenses connected to FixIT part time staff will be posted to the part-time staff account in the Fix-IT department and taken from membership fees collected for FixIT. Please see the PT Staff Cst Analysis tab for a detailed worksheet providing PT Staff cost estimates. Note that figures up to November are "actual" figures. 5019-0100 Internal Volunteer Recognition 2016-17 Budget Notes
$1,419 2016-17 total> 1,419.00 $ monthly> 118.25 $ 2017-18 Budget Notes QB expenditures will be applied for the first seven months. The monthly amount (see below) will be applied to remaining months. The aggregate will be "straight-line" estimated or specific planned program expenses will be entered. $500 for student volunteer appreciation for Orientation, January Orientation 5020-0100 Honorarium 2017-18 Budget Notes The honorarium account provides $150 each month for the Board Chairperson. Another $100 per month has been added as a contingency for any ad hoc Executive projects where a student may be hired to support ad hoc Executive projects. i.e. survey analysis, research projects 5030-0100 Full Time Benefits 2017-18 Budget Notes This account will include Desjardin Health Benefits, CPP, EI, pension, MSP 5030-0100 Full Time Benefits Average Monthly Cost based on five months of costs where a full FT Staff existed (addition of Finance Manager in June). Monthly Full-time Staff Expense > 18,125 5330-0100 Payroll Services Fees Note: I had to add this line in the Budget spreadsheet as it was missing though shown in the P & L account listing 5138-0100 Cable & Internet 2016-17 Budget Notes
2017-18 Budget Notes QB expenditures will be applied for the first seven months. The monthly amount (see below) will be applied to remaining months. monthly> $293.00 internet monthly> $100 cable 5139-0100 Telephone Cellphone charges 5040-0100 Part Time Benefits 2016-17 Budget Notes The SAGE accounting system has specific part-time benefit accounts for almost all departments. Generally, part-time staff benefits are reported in operating departments and/or corporate I.e. QB has a benefits lines for part time staff in Corporate and in Food and Beverage.
SAGE has benefit accounts for each service but also had accounts for each specific benefit - EI, CPP. Of concern, is that the benefits - CPP, EI , vacation pay - for staff cost cost taken from restricted funds (SUB Building Fee and UPASS, Shuttle, H and D, FixIT) have also been from restricted funds. Only the benefits for staff working in FixIT will be taken from earmarked funds. 2017-18 Budget Notes
In the 2017-18 budget, part-time staff costs will be applied in the Corporate department with the following exceptions:
5040-0100 Part Time Benefits 1,638 529 629 746 673 899 956 Average Monthly Cost based on six months of PT Staff Costs 738.67 Note: that when calculating the PT Staff Cost Benefits Average, I excluded April as the amount if twice the average and may be a misposting. Percentage of Average Monthly Cost of Benefits of PT Staff Expense Monthly Full-time Average Staff Expense (based on September/Oct/ 2017) Sept/Oct 2017 Average Monthly PT Staff Cost> 12,660 14,888 13,774.00 $ 2016-17 Average Monthly PT Staff Cost> 5.36% November PT Staff Cost Benefits Actuals = 5.67% To provide a conservative budget that ensures sufficient funds are budgeted for expense accounts, a PT Staff Benefits cost ration of 5.7% will be applied to PT Staff Costs. 5149-0100 Office Supplies 2016-17 Budget Notes
I am of the opinion that office supplies are a corporate expense, that the "Student Union Building" does not technically has an "office" but SUS (Corporate) does and that office supplies for Support Services essentially those provided for the Corporate offices/operations. The Food Services "office" is incorporated into SUS corporate offices. It is my belief that this was simply an extension
7,481 $ Monthly totals> 623 $ 2017-18 Budget Notes
I believe there is a strong likelihood that a percentage of these costs in fact were actually "operating expenses" and other types of costs but it would take a signficant effort and period of time to analyze and breakdown these costs and re-post them accurately. As a result, I have posted the totals as aggregated from the prior year in the manner described above.
7,481 $ Monthly totals> 623 $
September October November Average Monthly 649 $ 450 $ 489 $ 529 $ The monthly average will be applied to the remaining 2017-18 fiscal months with the exception of December where half the average will be plugged. 5050-0100 Professional Fees 2016-17 Budget Notes
2017-18 Budget Notes
the prior year is an anomaly. $7k is probably all that is required. Monthly Nov-March- 1,167 $
costs pending the completion of the audit in November.
monthly from November to March - 333 $ 1,500 $ 5070-0100 Marketing, Advertising & Promotion 2016-17 Budget Notes
2017-18 Budget Notes
600.00 $ SUS now has access to a Newsletter program which gives direct access to students to promote SUS activities and services. Hence, I have halved the last year's expenditures to $300 per month for the remaining months of the current fiscal year end. An additional $150 will be added to cover advertising for F and B
reflect past spending. The 2017-18 budget will be highly detailed and mapped monthly, showing ad spends for traditional advertising collateral and FB push ads, spending attached to broad strategic operational requirements, specific programs and events, and information campaigns 5080-0100 Licenses/Dues/Certificates 2016-17 Budget Notes
2017-18 Budget Notes
18,709.00 $ 5090-0100 Cash Over/Short 2017-18 Budget Notes A plug figure of $30 has been placed in this account. 5100-0100 Postage & Courier 2017-18 Budget Notes A plug figure of $30 has been placed in this account. 5110-0100 Contracted Services 2016-17 Budget Notes 2017-18 Budget Notes
gaps for lack of staff. These "temps" were not put on payroll and hence do not receive benefits and hence would lead to reconcilation issues re. taxes and benefits. This is a "one-off" occurrence which will not be reflected in any forecasting.
5130-0100 IT Software/Hardware/Support 2016-17 Budget Notes
2017-18 Budget Notes There were initial costs of over $1300 for the leasing of the space reservations software. This system was replace by an in-house designed system at no monthly expense.
5140-0100 Operating Supplies 2016-17 Budget Notes There is no single operating supplies line. 2017-18 Budget Notes Lacking any data, I have put put in a plug number of $200 per month. 5149-0100 Office Supplies 2016-17 Budget Notes Last year, office supplies costs in Operating is outlined below but there were also office supplies costs shown in other departments. 2,658.00 $ monthly average> 222 $ 2017-18 Budget Notes Current average monthly office supplies spending = 183 $ Given this average is derived from largely summer months when activity is lower than during the academic year and looking at the prior year's average, I have conservatively chosen $250 per month for the remainder of the fiscal year. 5150-0100 Small Equipment 2016-17 Budget Notes
1,575.00 $ monthly> 131.25 $ 2017-18 Budget Notes Current average monthly office supplies spending = 288 $ Reduced to $100 as many of these purchases should have been posted to SUB Building equipment expenses. $288 per month is budgeted for the remainder of the fiscal year. 5160-0100 Meetings 2016-17 Budget Notes There was not a meeting account line in last year's chart of account hence there is no spending history to apply. 2017-18 Budget Notes There were three extraordinary expenditures made by the VPI in March which have no detail. There were simlar large purchase, one by Krista Hofer. All of these were credit card purchases. There was an additional large purchase by the new VPI which does not have any detail provided. 1,570.00 $ 2,457.00 $ These expenses may have been related to SUS Awards in whichcse the expenses should have been posted back to the 2016-17 fiscal year and to "SUS Programs/Events". As a result, I will estimate meeting costs based on other meeting expenses made later in this fiscal year. From June to October, average monthly expenditures = 44 $ Because the average is based more on slower summer months that the high activity academic months, I have increased
5170-0100 Internal Volunteer Recognition 2016-17 Budget Notes
$1,419 2016-17 total> 1,419.00 $ monthly> 118.25 $ 2017-18 Budget Notes QB expenditures will be applied for the first seven months. The monthly amount (see below) will be applied to remaining months. The aggregate will be "straight-line" estimated or specific planned program expenses will be entered.
$500 for student volunteer appreciation for Orientation, January Orientation 5180-0100 Equipment Lease/Rental 2016-17 Budget Notes $314 was recorded in Operations. 2017-18 Budget Notes It appears the only current equipment lease/rental is the Xerox printer at $157 per quarter. However, I am concerned as to whether this is for the office printer, or the office FixIT printer. Finance Manager to confirm current leases for these two printers and…confirm that click fees are billed to copying and printing confirm the $157 is a quarterly invoice $157 quarterly has been budgeted. 5200-0100 Printing & Copying 2016-17 Budget Notes
The aggregated total for these printing costs not including Food Services was: 1,815.00 $ Average monthly expenses > 151.25 $ 2017-18 Budget Notes
131 $ $150 per month for printing has been budgeted for the remainder of the fiscal year. 5210-0100 Vehicle Op/Parking Pass 2016-17 Budget Notes $1300 was spent in the 2016-17 year. The bulk of this cost occurs at the start of the UFV and SUS fiscal year. Monthly average cost> 108 $ 2017-18 Budget Notes Projection of Parking Passes have three elements:
Last year's costs are used, those being approx. $110 per month. $110 per month
The costs for 3 additional spots for the last term of the school year as preparation for potential additional hires (3X$160= $480) $480 in January
The amount per semester would be $1,280 ($160 semester pass rate x 8 stalls) $1280 per term 5300-0100 Conferences/Travel 2016-17 Budget Notes 2017-18 Budget Notes Event Location Month Travel Estimated Travel Cost* Nights
Delegates Fees Cost CASA-Foundations Conference Ottawa May Flight 580.00 $ 6 1,350.00 $ 385.00 $ 2 Included 4,630 $ May CASA-Poli/Strat Western Canada July Flight 480.00 $ 6 1,350.00 $ 385.00 $ 2 Included 4,430 $ July CASA-Lobby Days Ottawa November Flight 580.00 $ 6 1,350.00 $ 385.00 $ 1 Included 2,315 $ November CASA-General Meeting Eastern Canada March Flight 730.00 $ 3 675.00 $ 220.00 $ 2 Included 3,250 $ March ABCS-General Meeting Lower Mainland June Drive 225.00 $ 2 450.00 $ 165.00 $ 3 Included 2,070 $ June ABCS Lobby Days Victoria October Drive 300.00 $ 3 675.00 $ 220.00 $ 2 300.00 $ 2,690 $ October UBC SLC Vancouver January Drive 75.00 $ 1
55.00 $ 3 60.00 $ 420 $ January UBC - SASC** Vancouer March Drive 150.00 $ 2 450.00 $ 110.00 $ 1 710 $ March UBC SUDS** Vancouver August Drive 225.00 $ 3 675.00 $ 165.00 $ 3 285.00 $ 3,600 $ August Total> 24,115 $ * per person, flight cost plus local transport i.e. taxi **Recommend driving in each day rather than hotel because of the location 5315-0100 Repairs & Maintenance Yearly Conferencing Events
2016-17 Budget Notes 2017-18 Budget Notes No expenses - will put a plug number of $50/month Sept cover up of windows - black out in Evered, application of decals for privacy in offices Oct - painting of offices These should be changed to SUS Building
Orientation Program (0201) 5010-0201 Part Time Staff Costs $3162 - honorarium for volunteers and extra staff cost for stat holiday work 5060-0201 Talent Fees (performers/speakers) 2,945.00 $ DJ, and Snot Nose Rez Kids 5120-0201 Production (AV-PA) Services 1,477.00 $ Rental of sound and lighting equipment for concert and DJ dance 5220-0201 Program/Event Expenses September 2017, Orientation Drum Line, Zaikas catered and Canoe catered lunch, hypnotist, "Inflatables" carnival, security guards, shuttle service to Langley and Chilliwack, stat holiday rates 23,301 $ January 2018, Orientation Zaikas catered and Canoe catered lunch, hypnotist, therapy dogs Pride Center Programs - Events (0202) 5140-0202 Operating Supplies Item Unit Price Count Subtotal Blankets $10.00 6 60 $ Lateral Filing Cabinet $12.00 1 12 $ Pillows $5.00 6 30 $ Resources
Sample Binders $16.74 3 50 $ Other Resources $100.00 1 100 $ Pamphlets $0.20 100 20 $ Menstrual Cup Sample $50.00 1 50 $ Pregnancy Tests $8.00 5 40 $ Condoms $0.00
Dental Dam $10.00 1 10 $ Total> 372 $ 5220-0202 Program/Event Expenses
$100 per year 100.00 $
coffee/tea 30.00 $ cookies 40.00 $ subtotal 70.00 $
Facilitator Honorarium $75 coffee/tea 30.00 $ cookies 40.00 $ subtotal 70.00 $ $215 Monthly Total 285.00 $ Gender Equality Center (0203) 5140-0202 Operating Supplies Item Unit Price Count Subtotal Blankets $10.00 6 60 $ Lateral Filing Cabinet $12.00 1 12 $ Pillows $5.00 6 30 $ Resources
Sample Binders $16.74 3 50 $ Other Resources $100.00 1 100 $ Pamphlets $0.20 100 20 $ Menstrual Cup Sample $50.00 1 50 $ Pregnancy Tests $8.00 5 40 $ Condoms $0.00
Dental Dam $10.00 1 10 $ Total> 372 $ 5220-0202 Program/Event Expenses
$100 per year 100.00 $
coffee/tea 30.00 $ cookies 40.00 $ subtotal 70.00 $
Facilitator Honorarium $75 coffee/tea 30.00 $ cookies 40.00 $ subtotal 70.00 $ $215 Monthly Total 285.00 $ SUS Programs - Events (0204) 5220-0204 Program/Event Expenses Events Month
November speaking fee 5,000.00 $ hospitality 30.00 $
Security 210.00 $ set up 2 staff X 2 hours @ 12/hr 48.00 $ tear down 2 staff X 2 hours @ 12/hr 48.00 $ Marketing-Printing (Posters) 100.00 $ Event Cost 5,436.00 $
November Speaking fee 300.00 $ Accommodation 89.00 $ Flights 900.00 $ Hospitality 80.00 $ Ground Transport 40.00 $ Gift 25.00 $ Security 840.00 $ set up 2 staff X 2 hours @ 12/hr 48.00 $ tear down 2 staff X 2 hours @ 12/hr 48.00 $ Marketing-Printing (Posters) 100.00 $ Event Cost 2,470.00 $ 7,906.00 $
December Marketing-Printing (Posters) 150.00 $ 10 hours of pt labour 120.00 $ travel costs 60.00 $ bags/decorations/ misc 200.00 $ 530.00 $
Winter Term/3 Mos Budget 1,000.00 $ 333.33 $
February Budget 300.00 $
March 500.00 $
March 4,000.00 $
February 3,000.00 $
December: cookies 170.00 $ 3 dates: Abbotsford w/ coffee/tea coffee (5 urns @ $30) 150.00 $ 2 dates - Chilliwack - just cookies tea (3 urns @ $30) 90.00 $ 410.00 $ January (two dates) cookies 68.00 $ coffee (2urns @ $30) 60.00 $ tea (2 urns @ $30) 60.00 $ 188.00 $
February (two dates) cookies 68.00 $ coffee (2urns @ $30) 60.00 $ tea (2 urns @ $30) 60.00 $ 188.00 $ March cookies 170.00 $ 3 dates: Abbotsford w/ coffee/tea coffee (5 urns @ $30) 150.00 $ 2 dates - Chilliwack - just cookies tea (3 urns @ $30) 90.00 $ 410.00 $ Total Program Costs 1,196.00 $ 5220-0204 Program/Event Expenses November December January February March Total 7,883.20 $ 940.00 $ 1,338.53 $ 4,638.53 $ 6,060.53 $ 20,860.80 $ 5220-0204 Program/Event Expenses CASCADE SUS - SL COLLEGIUM (2nd Floor SUB Lounge) Operating Budget - SUS Contribution Maintenance - Painting etc. 1,000.00 $
per week 204.30 $ monthly 817.20 $ The $1k is applied to building expenses. The $817.20 monthly in staff costs are applied to SUS Program/Events as the Collegium is a collaborative program with SL and SUS does not hire the employees but rather provides "program" funding in the form of a staff cost subsidy. Hence, these "staff" costs are not entered as liabilities to the SUS Corporate PT. Staff cost line. nor does SUS take on the responsibility of deducting PT. Staff benefits such as CPP, EI etc.
UPASS (0301) 5110-0301 Contracted Services 2016-17 Budget Notes
to UFV Chilliwack students.
# of Chilliwack students 1200-1400 fitness fee/semester 10.74 $ Estimate of total fees annually 37,590.00 $ Cheam Center Annual Fee 79,000.00 $ surplus/deficit (41,410.00) $ 2017-18 Budget Notes
To address the recurring deficit generated by the past agreements with the Cheam Gym in Chilliwacks, SUS responded to repeated requests made by
SUS negotiated with UFV to establish fitness programming and facilities and to grow these programs and facilities over two years. Annual Costs of SUS - UFV Chilliwack Fitness Project Summer Fitness Program Student Staff Cost: 5,135 $ Fall Fitness Program Student Staff Cost: 7,420 $ Winter Fitness Program Student Staff Cost (projected) 10,000 $ Subtotal - Operating Cost 22,555 $ Equipment Costs (one -time cost) 7,929 $ Total Costs 30,483 $ monthly amortization 2,540.28 $ 5130-0301 IT (software, hardware, tech support) Half of the ECARD ID reader support costs should be placed here Shuttle (0302) 5130-0302 IT (software, hardware, tech support) 2016-17 Budget Notes
$965 Shuttle IPAD service support - ECARD Contracted Service Supplier support of IPAD system 2017-18 Budget Notes QB expenditures will be applied for the first seven months. The monthly amount (see below) will be applied to remaining months. The aggregate will be "straight-line" estimated or specific planned program expenses will be entered. 2016-17 total> 965.00 $ monthly> 80.42 $ Increase to $125 per month see above - half of ECARD ID reader monthly fees should be applied to Shuttle, half to UPASS Awards-Scholarships-Grants-Endowments-Donations (0305) 5400-0305 SIP - Student Association Funding 2016-17 Budget Notes
$26,601 2017-18 Budget Notes QB expenditures will be applied for the first seven months. The monthly amount (see below) based on 2016-17 grants will be applied to remaining months. The aggregate will be "straight-line" estimated or specific planned program expenses will be entered. 2016-17 total> 26,601.00 $ monthly> 2,216.75 $ YTD 1,975.78 $ 5400-0305 SIP - Student Association Funding SEPT/OCT "ISO" SEPTEMBER OCTOBER Average 21.77 $ 293.00 $ 314.77 $ 5405-0305 Student Awards 2016-17 Budget Notes
$2,539 2017-18 Budget Notes QB expenditures will be applied for the first seven months. The monthly amount (see below) will be applied to remaining months. The aggregate will be "straight-line" estimated or specific planned program expenses will be entered. 2016-17 total> 2,539.00 $ monthly> 211.58 $ Spending on this ytd is for SUS Awards and are event costs that need to be moved to SUS Programming
5410-0305 Scholarships 2016-17 Budget Notes
$34,000 2017-18 Budget Notes $20,000 is the amount for which SUS has committed to this program. 5430-0305 Emergency Student Grants 2016-17 Budget Notes
$30,000 2017-18 Budget Notes Given the deficit situation, there is no planned donation from SUS to this fund other that those made via the SUS Philanthropic Policy vis student clubs and association activities 5435-0305 Restricted Donations-External Programs 2016-17 Budget Notes
$2,122 This amount is in SAGE Acct. 5887 - Restricted Donations - External Prog - General Operations and has the descriptor - Class Gift Donation 2017. 2017-18 Budget Notes There are no expenditures scheduled for this fiscal year.
Expenses 5150-0600 Small Equipment 2016-17 Budget Notes $837 2017-18 Budget Notes QB expenditures will be applied for the first seven months. The monthly amount (see below) will be applied to remaining months. 1.The aggregate will be "straight-line" estimated. 2016-17 total> 837.00 $ monthly> 69.75 $
9,016.87 $
5110-0600 Contracted Services 2016-17 Budget Notes
2017-18 Budget Notes
517 $ 5310-0600 Occupancy Charges
105,000.00 $ UFV's annual charges for HVAC, custodial, and common space services 5315-0600 Repairs & Maintenance 2016-17 Budget Notes 2017-18 Budget Notes
April - Evered Hall signage Sept cover up of windows - black out in Evered, application of decals for privacy in offices Oct - painting of offices These should be changed to SUS Building YTD total > 4,075.00 $ monthly average> 582.14 $ $582 will be applied monthly for remainder of fiscal year.
September - $1000 5325-0600 Credit Card & Bank Charges Despite gaps in some of the months YTD, it appears that these charges are approximately $50 per month. 5330-0600 Payroll Services Fees It depends what is SUS's planning for the size of the work force. If it is about 30 employees, it could be about $558 /month; if it is about 60 employees, it could be about $899/month. As of Nov. 20, SUS had 56 employees (pt and ft combined). SUS changed to a full service payroll service to better manage the turnover situation and reduce staff costs (finance officer/assistants (2)) and reduce time spent