
SLIDE 1
JOSEPH MCCORMICK, MD SUSAN FISHER-HOCH, MD
Professors of Epidemiology Brownsville Campus UTHealth School of Public Health
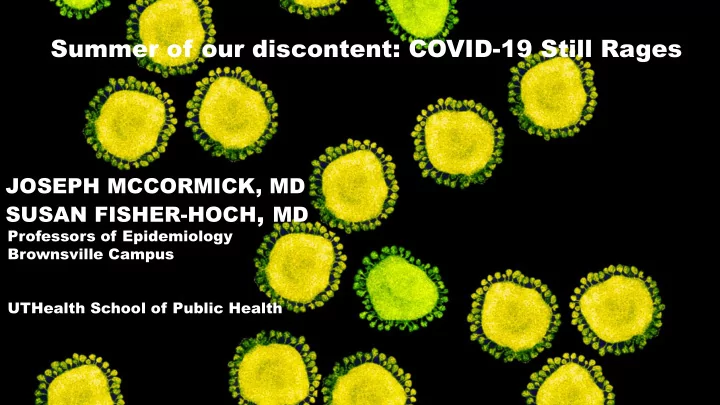
Summer of our discontent: COVID-19 Still Rages JOSEPH MCCORMICK, MD - - PowerPoint PPT Presentation
Summer of our discontent: COVID-19 Still Rages JOSEPH MCCORMICK, MD SUSAN FISHER-HOCH , MD Professors of Epidemiology Brownsville Campus UTHealth School of Public Health SOME HISTORY OF PLAGUES Plagues have been recorded over at least 5
JOSEPH MCCORMICK, MD SUSAN FISHER-HOCH, MD
Professors of Epidemiology Brownsville Campus UTHealth School of Public Health
Plagues have been recorded over at least 5 millennia Mass grave: China, 3000 BC
Dates Deaths Cause Prehistoric epidemics c3000 BC ? ? Plague of Athens 430 BC 100,000 ? Antonine Plague 165-180 >5 million ?smallpox Plague of Cyprian 250-271 ? ? Plague of Justinian 541-542 10% of global population Bubonic plague The Black Death 1346-1353 Half of Europe’s population Pneumonic plague Cocoliztli epidemic 1545-1548 15 million Salmonella paratyphi C American plagues 16th century Decimated Inca and Aztecs Several including smallpox Great Plague of London 1665-1666 >100,000 Pneumonic plague Great Plague of Marseille 1720-1723 30% of population Plague Russian Plague 1770-1772 >100,000 Plague Philadelphia Yellow Fever 1793 >5,000 Yellow fever Flu Pandemic 1889-1890 > 1 million Influenza American Polio Epidemic 1916 6000 Polio Spanish Flu 1918-1920 500 million Influenza AIDS 35 million HIV COVID-19 2019-?? ?690,0000 & counting Coronavirus
Just in case you thought COVID was somethings new….. Common underlying features are crowding and increased transport
1918
2020
The virus is named SARS-CoV-2 The disease is named COVID-19
Virus made of Proteins and RNA
KNOWN CORONAVIRUS FACTS
receptors found throughout the body and in the lung
enter the cell. Furin is ubiquitous in cells.
There are millions, billions or more likely trillions of viruses everywhere in nature including many unknown coronaviruses:
DNA viruses: Herpes, CMV, smallpox, adenoviruses, chickenpox Negative Strand RNA viruses: HIV, Polio, Influenza, Ebola, measles, mumps, Positive Strand RNA viruses: SARS-CoV-2, Dengue, west Nile, Zika, rhinoviruses, rubella
Reverse Transcriptase Reverse Transcriptase makes DNA copies of RNA
The Washington Post, August 13
Coronaviruses can ‘species jump’ When they do the results can be unexpected The original host may have no disease, the new host very sick.
SEVERE DISEASE
MILD DISEASE
‘LONG’ COVID DISEASE
The Washington Post, August 13
Viral targets for detection in the laboratory
Swab or Saliva sample for Viral RNA
PCR test copies Viral RNA into Many DNA copies Swab sample Antigen rapid test
Blood Test for Antibodies to proteins
many copies viral RNA to DNA specific for SARS-CoV-2.
Multiple reasons for false-negative PCR or Antigen test Ø Patient may be in the early stage with a low viral load Ø Patient may have no major respiratory symptoms. Ø Problem with sample collection, so very little sample to test. Ø Poor handling and shipping of samples and test materials. Ø There may have been technical issues inherent in the test. Ø The antigen test is less sensitive so more false negatives The WHO suggests that these issues should be taken into account and that for some people, tests should be carried out several times
be spread by aerosol. WHO finally agreed.
for several meters and hang around for hours in closed spaces.
(aerosol) particles contain the virus
infected people.
rather like passing a person smoking.
SOME AEROSOL DATA
L.C.Marr, NYT, July 30th, professor of civil and environmental engineering
detectable coronavirus. Nature July 29, University of Florida
liquid over a wide spectrum of sizes containing virus from the lungs
travelling many meters
proven.
Potential air duct spread
Westport, CT then scattered across the region and the world, taking the coronavirus with them.
known case of the coronavirus on the day of the party. It had 85 ten days later, up more than 40-fold in 11 days.
evening for Johannesburg, New York City and other parts of Connecticut and the United States, seeding infections on the way.
Aerosol transmission in a restaurant in Guangzhou
Li et al preprint
3 families, A B and C, ate lunch at this restaurant on the eve of the Chinese New
already infected. 10 were later found to have SARS-
restaurant was poorly
infected
Cameron County Daily Cases of COVID19
0% 10% 20% 30% 40% 50% 60% 70% 80% 90% 100% Week 1 (6th April - 11th April) Week 2 (13th April - 18th April) Week 3 (20th April - 25th April) Week 4 (27th April - 2nd May) Week 5 (4th May - 9th May) Week 6 (11th May - 16th May) Week 7 (18th May - 23rd May) Week 8 (25th May - 30th May) Week 9 (1st June - 6th June) Week 10 (8th June - 13th June) Week 11 (15th June - 20th June) Week 12 (22nd June - 27th June) Week 13 (29th June - 4th July) Week 14 (6th July - 11th July) 26% 31% 35% 25% 30% 44% 45% 34% 45% 64% 64% 59% 62% 59% 74% 69% 65% 75% 70% 56% 55% 66% 55% 36% 36% 41% 38% 41%
Cameron County COVID-19 Case Report: Percentage of Cases by Age Group per Week
> 40 15-40
0% 10% 20% 30% 40% 50% 60% 70% 80% 90% 100% Week 1 (6th April - 11th April) Week 2 (13th April - 18th April) Week 3 (20th April - 25th April) Week 4 (27th April - 2nd May) Week 5 (4th May - 9th May) Week 6 (11th May - 16th May) Week 7 (18th May - 23rd May) Week 8 (25th May - 30th May) Week 9 (1st June - 6th June) Week 10 (8th June - 13th June) Week 11 (15th June - 20th June) Week 12 (22nd June - 27th June) Week 13 (29th June - 4th July) Week 14 (6th July - 11th July) 10% 18% 14% 12% 15% 21% 18% 36% 25% 41% 40% 53% 63% 66% 86% 77% 86% 82% 79% 75% 71% 55% 68% 50% 55% 43% 33% 33% 3% 5% 0% 6% 6% 4% 11% 9% 8% 9% 4% 3% 4% 1%
Cameron County COVID-19 Daily Case Reporting: Mode of Disease Spread per Week
Travel Link to previous case Commun ity
50 100 150 200 250 300 350 400 450 500 ≤ 18 19-29 30-39 40-49 50-59 60-69 70-79 ≥ 80
Frequency Age category
Cameron County COVID-19 Daily Case Report: Age Distribution by Type of Transmission
Community Link to previous case Travel
2 4 6 8 10 12 14 16 18 09-Apr 16-Apr 23-Apr 30-Apr 07-May 14-May 21-May 28-May 04-Jun 11-Jun 18-Jun 25-Jun 02-Jul 09-Jul 16-Jul 23-Jul
Number of deaths Date
Cameron County Covid-19 Related Deaths (9th April - 23rd July)
No of Deaths 5-day average
GLOBAL OVERVIEW: WHO updated August 4
Pop 330 million Pop 446 million
Populations China 1.4 billion US 330 million Brazil 210 million Russia 145 million Japan 127 million Italy 60 million US has 4% of world population But 25% of cases and 22.4% of deaths
In countries that had the virus under ‘control’ it is making a comeback Predictions for the fall when influenza joins the fray are not good.
May Schools reopened
New York Times July 22, 2020
If Texas were a country It would have the 6th Highest Cases in the world
However, excess deaths suggest that the real numbers may already be over 200,000 nationally NYT August 13
COUNTRY CONFIRMED DEATHS CASE- FATALITY DEATHS/100K POP.
Belgium 70,314 9,850 14.0% 86.24 United Kingdom 307,251 46,295 15.1% 69.63 Spain 297,054 28,472 9.6% 60.94 Italy 248,229 35,166 14.2% 58.19 Sweden 81,012 5,744 7.1% 56.41 US 4,713,540 155,402 3.3% 47.50 Brazil 2,750,318 94,665 3.4% 45.19 France 225,198 30,268 13.4% 45.18 Mexico 443,813 48,012 10.8% 38.05 Death per 100K population and case fatality in selected countries
Should Schools Reopen and When?
Ø During 17 to 20th § 138 trainees and 120 staff members all documented SARS-CoV- 2 negative 2 days prior to arrival, media age 17 years Ø 597 Georgia residents attended, median age 12 § Average 15 per cabin Ø One adolescent became ill and was positive Ø 260/344 available tests were positive Age group (yrs.) No No positive Attack rate % 6-10 100 51 51 11-17 409 180 44 18-21 81 27 33 22-59 7 2 29
SARS-CoV-2 transmission and infections among attendees of an
In this US population–based time series analysis conducted between March 9, 2020, and May 7, 2020, school closure was associated with a significant decline in both incidence of COVID-19 (adjusted relative change per week, −62%) and mortality (adjusted relative change per week, −58%). In a model derived from this analysis, it was estimated that closing schools when the cumulative incidence of COVID-19 was in the lowest quartile compared with the highest quartile was associated with 128.7 fewer cases per 100 000 population over 26 days and with 1.5 fewer deaths per 100 000 population over 16 days. May, Schools reopened Auger, K.A. et al, JAMA July 29
Contact Tracing during Coronavirus Disease Outbreak, South Korea, 2020 Ø Detected COVID-19 in 11.8% of household contacts; rates were higher for contacts of children than adults. Ø The highest COVID-19 rate (18.6%) was for household contacts of school-aged children Ø The lowest (5.3%) for household contacts of children 0–9 years in mid school closure. Ø A contact survey in Wuhan and Shanghai, China, showed school closure and social distancing significantly reduced the rate of COVID-19 among contacts of school-aged children. Ø For seasonal influenza, the highest secondary attack rate occurs among young children. Ø Children who attend day care or school also are at high risk for transmitting respiratory viruses to household members. Ø The low detection rate for household contacts of preschool-aged children in South Korea might be attributable to social distancing during these periods. Ø a recent report from Shenzhen, China, showed that the proportion of infected children increased during the outbreak from 2% to 13%, suggesting the importance of school closure
Schools should reopen only when the transmission in the community is under reasonable control
Ø Well established drug Ø Dampens over reactive immune response to the virus Ø Reduces 28-day mortality RECOVERY TRIAL (NEJM July 17 20): Ø Performed in 176 NHS institutions in the UK by Nuffield Department of Population Health at Oxford University Ø 9355 patients randomized: 2104 dexamethasone, 4321 usual care Ø Mean age 66.1, 24% diabetes, 27% heart disease, 21% lung disease Ø Mortality significantly lower on dexamethasone (RR 0.83) Ø Patients on dexamethasone had shorter duration of hospitalization Ø Patient on dexamethasone had lower mortality, particularly those ventilated (RR 0.92). Ø Patients on dexamethasone less likely to need ventilation (RR 0.77)
DEXAMETHASONE
A: All participants B: Invasive mechanical ventilation C: Oxygen only D: No oxygen Mortality at 28 days according to respiratory support at randomization
Conclusions: Ø Dexamethasone reduces 28- day mortality in patients on respiratory support Ø No benefit and possibility of harm in patients not requiring oxygen Ø Dexamethasone is on WHO list of essential medicines
Ø GS-5734: inhibitor of viral RNA-dependent RNA polymerase Ø Reduced lung virus levels and lung damage Ø Antiviral active against SARS-CoV-2 Ø Probably most effective given early in disease
Ø 1063 patients, randomized: 538 Remdesivir, 521 placebo. Ø Multisite international study: 60 trial sites, Ø Mean age 59, multiracial, many with pre-existing conditions Ø Intravenous delivery Ø Time to recovery: 11 days remdesivir, 15 days placebo (RR1.32) Ø Mortality by 14 days: 7.1% remdesivir, 11.9% placebo (HR0.70) Ø Serious adverse events: 21.1% remdesivir, 27% placebo Ø Comment: treatment given late in disease
A: Overall B: Patients not receiving oxygen C: Patients receiving oxygen D: Patients receiving high flow oxygen E: Patients receiving ventilation Blue line remdesivir Red line placebo
estimates of cumulative recoveries with remdesivir treatment
Data Safety and Monitoring Board unblinded the study early so that findings could be published Conclusions
requiring oxygen
sufficient
diagnosis had a seven-day death rate of 8.7%
mortality rate of 11.9%. The difference met the standard for statistical significance.
antibody levels Effect of Convalescent Plasma on Mortality among Hospitalized Patients with COVID-19: Initial Three-3 Month Experience
Joyner et al, Mayo Clinic medRxiv preprint doi: https://doi.org/10.1101/202
?HERD IMMUNITY Ø When people are infected by coronaviruses that cause cold-like symptoms, they are immune for less than a year. Ø By contrast, those infected by the original more severe SARS virus, stayed immune for much longer. Ø If SARS-CoV-2 lies somewhere in the middle, people who recover from their encounters might be protected for a couple of years. Ø We need data to understand when immune citizens can return to work, care for the vulnerable, and anchor the economy during bouts of social distancing. Ø We need to anticipate new waves of infection, or ongoing smaller epidemics, like the flu, which, like the poor is always with us.
PREVENTION OF SPREAD Ø Wear a mask in any public or enclosed space or within 6 feet of anyone outside your family Ø Quilted cloth masks are comfortable and best short of PPE Ø Consider your mask a fashion statement or a message. Ø Wash hands frequently, especially when out of home. Ø Stay 6 feet from anyone outside your family. (10 feet is better) Ø Avoid entering any enclosed, ill ventilated spaces e.g. bars Ø Open windows wherever possible Ø Protect the elderly and anyone with pre-existing conditions (obesity, heart disease, diabetes or immunosuppressed)
Masks, masks, masks, masks……….
spaces
disrespectful of others
making masks. Expensive ones Balenciaga $$$$ Humor ????
Green no mask Red Bandana OrangeCotton Blue Surgical
SOCIAL DISTANCING ALSO WORKS
GUIDE TO SOCIAL DISTANCING
Resistance is not new either: 19th Century York cholera and flu
Principles of the immune response
Washington Post august 13 2020
Virus Targets for Vaccine development
RNA Of the Viral spike Protein is the target Of most vaccines
Moderna vaccine now in Phase Three Trial in US
Moderna COVID-19 experimental mRNA vaccine: mRNA-1273 Primate studies: Ø Vaccinated macaques high levels of neutralizing antibodies above natural infection directed at the surface spike protein Ø Induced cell killing immune response Ø At challenge none had detectable virus in the nose Human studies Ø Phase I and II complete q Some pain at injection site q Some fever and headache treated with Tylenol Ø Phase III: initiated July 30th with 30,000 volunteers
Oxford University Vaccine now in Phase Three Trial in UK
The Washington Post, August 13
Most residents were exercising recommended vigilance, Mr. Haskell said, but one call that stuck out to him was from a woman awaiting test results whose entire family had been exposed to the virus. “She wanted to know whether or not to tell her friends and social network,” he said, because she was worried about “social stigma.” “I don’t believe I’m the problem anymore,” the South African at the party in Westport told The Sunday Times. “It seems that the real problem is now the people who are too scared to say anything. The problem is the ignorance of the public.”
STIGMA AND PERCEPTIONS
URGENT What needs to be done?
As much as possible
responders, police etc. for PPE and testing