
SLIDE 1
Summary of Higher Education Non-formula Support Items
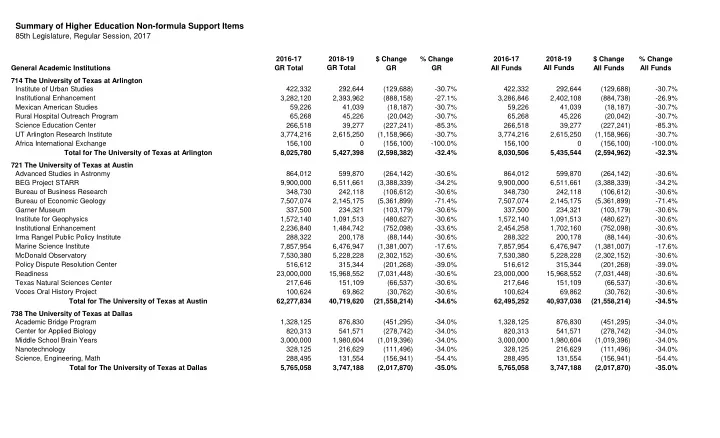
85th Legislature, Regular Session, 2017
2016-17 $ Change % Change 2016-17 $ Change % Change GR Total GR GR All Funds All Funds All Funds Institute of Urban Studies 422,332 292,644 (129,688)
- 30.7%
422,332 292,644 (129,688)
- 30.7%
Institutional Enhancement 3,282,120 2,393,962 (888,158)
- 27.1%
3,286,846 2,402,108 (884,738)
- 26.9%
Mexican American Studies 59,226 41,039 (18,187)
- 30.7%
59,226 41,039 (18,187)
- 30.7%
Rural Hospital Outreach Program 65,268 45,226 (20,042)
- 30.7%
65,268 45,226 (20,042)
- 30.7%
Science Education Center 266,518 39,277 (227,241)
- 85.3%
266,518 39,277 (227,241)
- 85.3%
UT Arlington Research Institute 3,774,216 2,615,250 (1,158,966)
- 30.7%
3,774,216 2,615,250 (1,158,966)
- 30.7%
Africa International Exchange 156,100 (156,100)
- 100.0%
156,100 (156,100)
- 100.0%
Total for The University of Texas at Arlington 8,025,780 5,427,398 (2,598,382)
- 32.4%
8,030,506 5,435,544 (2,594,962)
- 32.3%
Advanced Studies in Astronmy 864,012 599,870 (264,142)
- 30.6%
864,012 599,870 (264,142)
- 30.6%
BEG Project STARR 9,900,000 6,511,661 (3,388,339)
- 34.2%
9,900,000 6,511,661 (3,388,339)
- 34.2%
Bureau of Business Research 348,730 242,118 (106,612)
- 30.6%
348,730 242,118 (106,612)
- 30.6%
Bureau of Economic Geology 7,507,074 2,145,175 (5,361,899)
- 71.4%
7,507,074 2,145,175 (5,361,899)
- 71.4%
Garner Museum 337,500 234,321 (103,179)
- 30.6%
337,500 234,321 (103,179)
- 30.6%
Institute for Geophysics 1,572,140 1,091,513 (480,627)
- 30.6%
1,572,140 1,091,513 (480,627)
- 30.6%
Institutional Enhancement 2,236,840 1,484,742 (752,098)
- 33.6%
2,454,258 1,702,160 (752,098)
- 30.6%
Irma Rangel Public Policy Institute 288,322 200,178 (88,144)
- 30.6%
288,322 200,178 (88,144)
- 30.6%
Marine Science Institute 7,857,954 6,476,947 (1,381,007)
- 17.6%
7,857,954 6,476,947 (1,381,007)
- 17.6%
McDonald Observatory 7,530,380 5,228,228 (2,302,152)
- 30.6%
7,530,380 5,228,228 (2,302,152)
- 30.6%
Policy Dispute Resolution Center 516,612 315,344 (201,268)
- 39.0%
516,612 315,344 (201,268)
- 39.0%
Readiness 23,000,000 15,968,552 (7,031,448)
- 30.6%
23,000,000 15,968,552 (7,031,448)
- 30.6%
Texas Natural Sciences Center 217,646 151,109 (66,537)
- 30.6%
217,646 151,109 (66,537)
- 30.6%
Voces Oral History Project 100,624 69,862 (30,762)
- 30.6%
100,624 69,862 (30,762)
- 30.6%
Total for The University of Texas at Austin 62,277,834 40,719,620 (21,558,214)
- 34.6%
62,495,252 40,937,038 (21,558,214)
- 34.5%
Academic Bridge Program 1,328,125 876,830 (451,295)
- 34.0%
1,328,125 876,830 (451,295)
- 34.0%
Center for Applied Biology 820,313 541,571 (278,742)
- 34.0%
820,313 541,571 (278,742)
- 34.0%
Middle School Brain Years 3,000,000 1,980,604 (1,019,396)
- 34.0%
3,000,000 1,980,604 (1,019,396)
- 34.0%
Nanotechnology 328,125 216,629 (111,496)
- 34.0%
328,125 216,629 (111,496)
- 34.0%
Science, Engineering, Math 288,495 131,554 (156,941)
- 54.4%
288,495 131,554 (156,941)
- 54.4%
Total for The University of Texas at Dallas 5,765,058 3,747,188 (2,017,870)
- 35.0%
5,765,058 3,747,188 (2,017,870)
- 35.0%