*Sum of new residential listings added to the MLS within the same - - PowerPoint PPT Presentation

sum of new residential listings added to the mls within
SMART_READER_LITE
LIVE PREVIEW

*Sum of new residential listings added to the MLS within the same - - PowerPoint PPT Presentation

Number of Residential Listings * added per week - 2019 & 2020 5000 Phase II re-open FL June 5th 4500 4000 3500 3000 2019 2500 2020 2000 1500 Linear (2019) 1000 Linear (2020) 500 0 22 23 24 25 26 27 28 29 30 31 32 33


slide-1
SLIDE 1

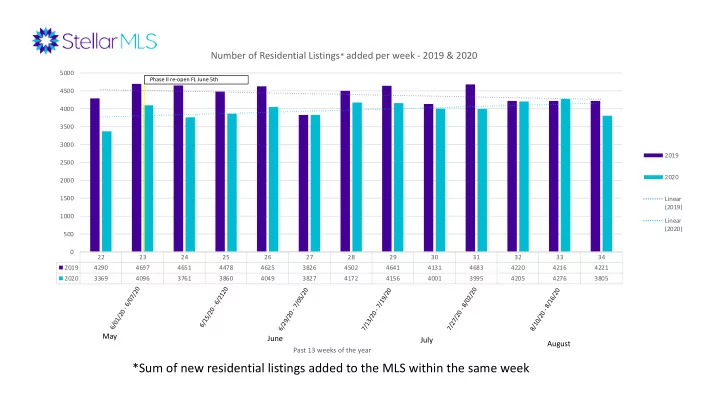
*Sum of new residential listings added to the MLS within the same week

22 23 24 25 26 27 28 29 30 31 32 33 34 2019 4290 4697 4651 4478 4625 3826 4502 4641 4131 4683 4220 4216 4221 2020 3369 4096 3761 3860 4049 3827 4172 4156 4001 3995 4205 4276 3805 500 1000 1500 2000 2500 3000 3500 4000 4500 5000

Past 13 weeks of the year

Number of Residential Listings* added per week - 2019 & 2020

2019 2020 Linear (2019) Linear (2020)

May

6/01/20 - 6/07/20

Phase II re-open FL June 5th

6/15/20 - 6/2120

June

6/29/20 - 7/05/20 7/13/20 - 7/19/20 7/27/20 - 8/02/20

July

8/10/20 - 8/16/20

August

slide-2
SLIDE 2

*Sum of closed residential listings within the same week

22 23 24 25 26 27 28 29 30 31 32 33 34 2019 4995 3534 3906 3804 5461 2629 3601 3843 3661 5130 3274 3699 3362 2020 2854 2582 2629 3189 3395 4463 3011 3782 3193 4689 3223 3296 3241 1000 2000 3000 4000 5000 6000

Past 13 weeks of the Year

Comparison of the Number of Residential Closings* 2019 & 2020 by week

2019 2020 Linear (2019) Linear (2020)

May

6/01/20 - 6/07/20 Phase II re-open FL June 5th 6/15/20 - 6/21/20

June

6/29/20 - 7/05/20 7/13/20 - 7/19/20 7/27/20 - 8/02/20

July

8/10/20 - 8/16/20

August

slide-3
SLIDE 3

*Average DOM of closed residential listings within the same week

22 23 24 25 26 27 28 29 30 31 32 33 34 2019 62 58 62 52 57 59 55 56 54 52 52 55 53 2020 49 58 49 50 53 51 57 51 60 56 62 57 102

20 40 60 80 100 120

Past 13 weeks of the Year

Average DOM of closed residential listings within the same week- for 2019 & 2020

2019 2020 Linear (2019) Linear (2020)

May

6/01/20 - 6/07/20 Phase II re-open June 5th

June

6/15/20 - 6/21/20 6/29/20 - 7/05/20 7/13/20 - 7/19/20 7/27/20 - 8/02/20

July

8/10/20 - 8/16/20

August

A listing of 408 DOM was sold, increasing this week’s avg.

slide-4
SLIDE 4

Week of June 22nd , 2020

11.4%

Compared to same week in 2019

15.3%

Week of July 20th, 2020

Compared to same week in 2019

16.5%

Week of August 17th,2020

Compared to the same week in 2019

Listing changes to Pending status with comparison to previous weeks

Current week 4 weeks ago 8 weeks ago

2020 2019

22 23 24 25 26 27 28 29 30 31 32 33 34 2019 4548 4763 4789 4840 4940 4197 4598 4727 4604 4507 4537 4339 4421 2020 4912 5433 5468 5749 5502 5099 5290 5446 5307 5171 5057 5248 5152 1000 2000 3000 4000 5000 6000 7000

Number of status changes

Week Start Date

Pending's over a 13 week period for 2019 & 2020

6/01/20 6/15/20 6/29/20 7/13/20 7/27/20

8/10/20

slide-5
SLIDE 5

Number of open house showings Per day from 5/25 to 8/23

Open Houses Virtual

200 400 600 800 1000 1200 1400 1600 1800 2000 2 5

  • M

a y 2 7

  • M

a y 2 9

  • M

a y 3 1

  • M

a y 2

  • J

u n 4

  • J

u n 6

  • J

u n 8

  • J

u n 1

  • J

u n 1 2

  • J

u n 1 4

  • J

u n 1 6

  • J

u n 1 8

  • J

u n 2

  • J

u n 2 2

  • J

u n 2 4

  • J

u n 2 6

  • J

u n 2 8

  • J

u n 3

  • J

u n 2

  • J

u l 4

  • J

u l 6

  • J

u l 8

  • J

u l 1

  • J

u l 1 2

  • J

u l 1 4

  • J

u l 1 6

  • J

u l 1 8

  • J

u l 2

  • J

u l 2 2

  • J

u l 2 4

  • J

u l 2 6

  • J

u l 2 8

  • J

u l 3

  • J

u l 1

  • A

u g 3

  • A

u g 5

  • A

u g 7

  • A

u g 9

  • A

u g 1 1

  • A

u g 1 3

  • A

u g 1 5

  • A

u g 1 7

  • A

u g 1 9

  • A

u g 2 1

  • A

u g 2 3

  • A

u g

Number of Open Houses

Showings for Open houses virtual tours

*Data used is based on each new week being added to existing data from previously query results.