
SLIDE 1
#MIGlobal
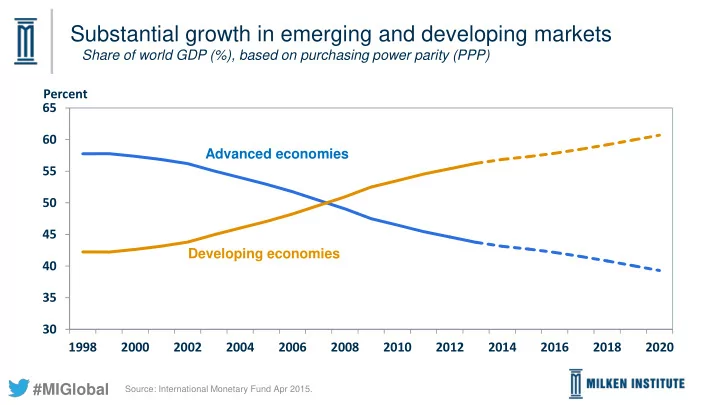
Substantial growth in emerging and developing markets
Share of world GDP (%), based on purchasing power parity (PPP) 30 35 40 45 50 55 60 65 1998 2000 2002 2004 2006 2008 2010 2012 2014 2016 2018 2020 Advanced economies Developing economies
Source: International Monetary Fund Apr 2015.