streamstats
play

StreamStats- Approaches for Estimating Basin and Streamflow - PowerPoint PPT Presentation

Swiftcurrent Creek at Many Glacier, MT-2006 StreamStats- Approaches for Estimating Basin and Streamflow Characteristics for Montana In cooperation with Montana Department of Natural Resources and Conservation, Montana Department of


  1. Swiftcurrent Creek at Many Glacier, MT-2006 StreamStats- Approaches for Estimating Basin and Streamflow Characteristics for Montana In cooperation with Montana Department of Natural Resources and Conservation, Montana Department of Transportation, and Montana Department of Environmental Quality U.S. Department of the Interior U.S. Geological Survey
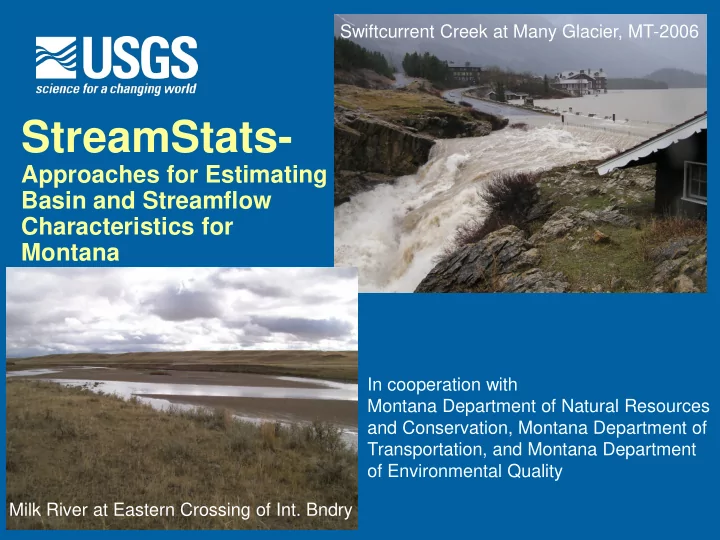
 Milk River at Eastern Crossing of Int. Bndry

  2. StreamStats - Web Application  Nationally standardized web tool developed by USGS Office of Surface Water  For gaged sites: provides published streamflow statistics and basin characteristics  For ungaged sites: solves previously published regression equations to estimate streamflow statistics using basin characteristic data  User access via an interactive map

  3. StreamStats Coverage for MT

  4. What are Streamflow Characteristics and why are they important?  Ways to summarize streamflow data  Basic summary statistics  Range (e.g. max, min)  Mean (e.g. daily, monthly)  Flow-duration analyses (e.g. exceedance flows)  Frequency analyses (e.g. 100-year flood)  Intended use determines type of analyses and data period

  5. Steps for developing StreamStats 1. Compute streamflow characteristics for discontinued and active gages in Montana and surrounding areas.  Compute flood 1978 frequencies 2011  Compute low flow and median flow characteristics Pryor Creek at Huntley 2 10 100 500

  6. Low Flow Statistics

  7. Flood Frequencies Yellowstone River at Miles City Pre-regulation 1923-1964 1944 Post-regulation 1965-2011 1978 2011 2 10 100 500 2 10 100 500

  8. Steps for developing StreamStats 2. Prepare GIS data for computing basin characteristics (BCs)  Drainage area  Slope  Elevation  Shape  Climatic characteristics, e.g. precipitation, evaporation, air temperature  Land-cover/use  Soils/geology

  9. Basin Characteristics Green- currently avail. Grey- most will be avail. Blue-data covering MT only Red-data covering US only

  10. Steps for developing StreamStats 3. Develop regional regression equations using computed streamflow characteristics and BCs.  Regression equations might take the form: Q 100 = 0.352*CA 0.960 *S 1.25 or Q 100 = 362*CA 0.521 *PII 4.47 where: Q 100 is the 100-year flood CA is contributing drainage area, in square miles S is main-channel slope, in feet per mile PII is precipitation intensity index, in inches

  11. Regression Equations  Flood Frequency Data  Low Flow Data http://www.huntleyproject.net/pryor-creek-flooding/

  12. Steps for developing StreamStats 4. Deploy StreamStats with GIS data and regression equations.  National StreamStats page: http://water.usgs.gov/osw /streamstats/index.html  http://streamstats09.cr.us gs.gov/mt_ss/index.htm

  13. Coming soon to Streamstats  Streamgages  Parrett WRIR 03-4308  McCarthy SIR 2004- 5266  Dams  Additional basin characteristics Prickly Pear Creek nr. Clancy, MT-1981

  14. Coming next fall to Streamstats  New flood Gibson Dam on the Sun River June, 1964 – crest length 960 feet frequencies  New low flow stats  New regression equations Photograph taken by George F. Roskie, Lewis and Clark National Forest

Download Presentation
Download Policy: The content available on the website is offered to you 'AS IS' for your personal information and use only. It cannot be commercialized, licensed, or distributed on other websites without prior consent from the author. To download a presentation, simply click this link. If you encounter any difficulties during the download process, it's possible that the publisher has removed the file from their server.

Recommend


More recommend