
SLIDE 1
1
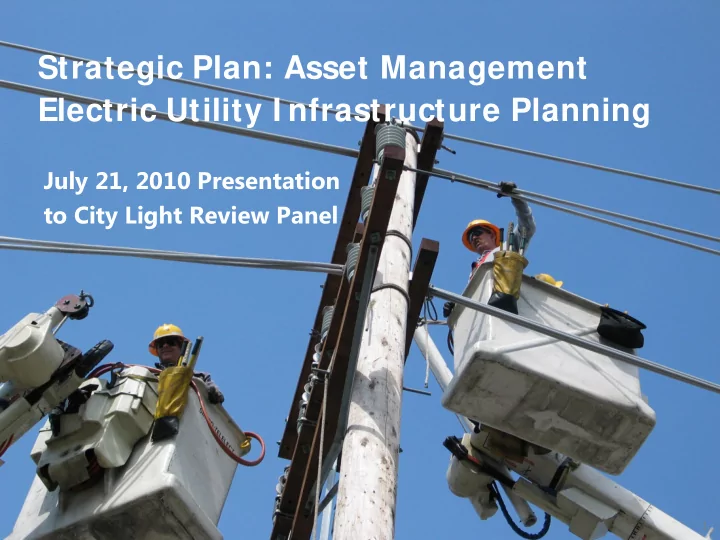
July 21, 2010 Presentation to City Light Review Panel
Strategic Plan: Asset Management Electric Utility I nfrastructure Planning
Strategic Plan: Asset Management Electric Utility I nfrastructure - - PowerPoint PPT Presentation
Strategic Plan: Asset Management Electric Utility I nfrastructure Planning July 21, 2010 Presentation to City Light Review Panel 1 Proposed Long-Term Strategic Priorities 1. Infrastructure Maintenance and Renewal Maintain Reliability
1
July 21, 2010 Presentation to City Light Review Panel
Strategic Plan: Asset Management Electric Utility I nfrastructure Planning
2
Proposed Long-Term Strategic Priorities
1.
Infrastructure Maintenance and Renewal
2.
Environmentally Responsible Operations
3.
High Performance Organization & Workforce
Utility Infrastructure and Assets Utility Infrastructure and Assets
7 dams 7 Generation Stations 26 powerhouse transformers
660 Circuit Miles of Transmission
1200 Steel Lattice Transmission Towers 700 Transmission Poles 15 major substations 53,720 Transformers
transformers
Transformers 167 Electric Feeders 108,000 Poles 84,000 Street Lights 2400 miles of Distribution Line
~ 400,000 customer meters 71,500 in Suburban Cities (Shoreline, Lake Forest Park, Tukwila, Burien) and unincorporated King County
$630 M $ 1.7 B $ 1.7 B Priceless $ 60 M
Seattle – 1900’s
Seattle 1962 from Space Needle
Seattle Today
7
SCL Service Territory Population and Electric Peak
100 200 300 400 500 600 700 800 1900 '10 '20 '30 '40 '50 '60 '70 '80 '90 2000 500 1000 1500 2000 2500 Pop'n MW Peak
Population, 1000’s MW Peak
1940 Ross Dam 1929 Diablo Dam 1924 Gorge Dam 1967 Boundary Dam
8
Asset Failure for an Asset Class
Constant (Random) Failures Early “Infant Mortality” Failures Decreasing Failure Rate Stable Failure Rate Increasing Failure Rate
Failure Rate Time
Wear out Failures Observed Failure Rate
9
Option#1: Run to Failure
Status Quo – highest risk; highest cost
Including environmental spills
Option #2: Age-Based Replacement
Replace on Proactive Schedule – lower risk – higher cost
using other rule of thumb
Option #3: Asset Management
Optimizes cost and risk –
equipment types
Asset Replacement Alternatives
10
Asset Management Practices
Cost of pole replacement after failure:
Cost of planned pole replacement
“Run to Failure” is Costly
11
Strategy – Infrastructure Improvement Options
Proposed Tomorrow Today Tomorrow Impact of Delay Today Result: Increased Rates Decreased Reliability Result: More Predicable Rates Increased Reliability
12
Strategic Plan: Infrastructure Maintenance and Replacement Programs
T&D Assets Program Description A
(current funding)
B
(Proposed)
C
(Slower pace)
Distribution – Wood Poles Pole Replacement (88,000
wood distribution poles)
600 poles 2000 poles 1500 poles
Distribution – UG Cable Cable Injection & Replacement (500 Mi UG)
30 Mi Inject 5 mi Replacement 30 Mi Inject 8.5 mi Replacement Degradation
for customers
Distribution – Network Network Vault Rebuild
(2400 Street Enclosures) 7 rebuilt annually 20 /yr 15 /yr
Transmission Steel Towers Inspect and evaluate necessary corrective action
(1200 steel lattice towers)
One yr Pilot 60 Towers 1140 towers
1140 towers
Transmission – Line Transmission Assessment & Maintenance (650 Miles)
Vegetation patrol Full Inspection
Full Inspection
13
Strategic Plan: Infrastructure Maintenance and Replacement Programs
Assets Program Description A
(Existing budget)
B
(Proposed)
C
(Slower pace)
T&D Substation Substation Transformer Replacement
(67 Transformers)
1 per yr 2 per yr (2013-14) N/A
Generation Major and Minor Maintenance
Rescheduled maintenance plans Restore previous funding
Generation Unit Automation
Rescheduled projects Restore previous funding
Generation Unit Upgrades & Rehabilitation Strategy
Rescheduled projects Restore previous funding
14