SLIDE 1
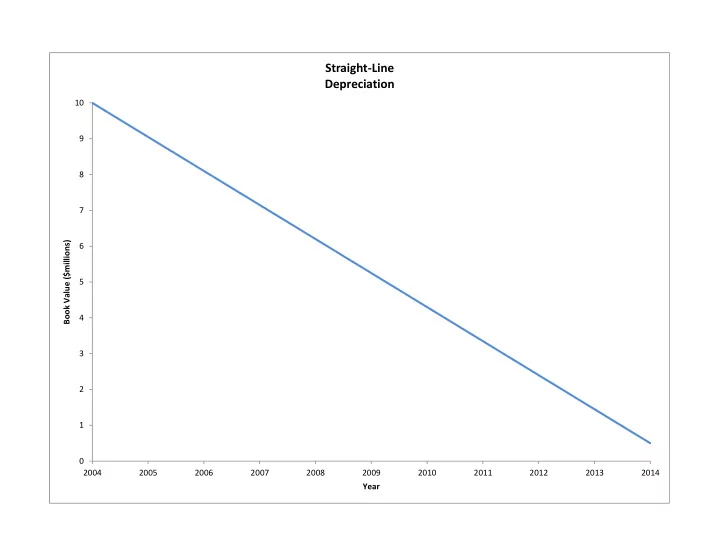
1 2 3 4 5 6 7 8 9 10 2004 2005 2006 2007 2008 2009 2010 2011 2012 2013 2014 Book Value ($millions) Year
Straight‐Line Depreciation
SLIDE 2
1 2 3 4 5 6 7 8 9 10 2004 2005 2006 2007 2008 2009 2010 2011 2012 2013 2014 Book Value ($millions) Year
Double‐Declining Balance Depreciation
SLIDE 3
1 2 3 4 5 6 7 8 9 10 2004 2005 2006 2007 2008 2009 2010 2011 2012 2013 2014 Book Value ($millions) Year
Declining Balance Depreciation
SLIDE 4
1 2 3 4 5 6 7 8 9 10 2004 2005 2006 2007 2008 2009 2010 2011 2012 2013 2014 Book Value ($millions) Year
Double‐Declining Balance Switching to Straight‐Line
SLIDE 5
1 2 3 4 5 6 7 8 9 10 2004 2005 2006 2007 2008 2009 2010 2011 2012 2013 2014 Book Value ($millions) Year
Double‐Declining Balance Switching to Straight‐Line
SLIDE 6
1 2 3 4 5 6 7 8 9 10 2004 2005 2006 2007 2008 2009 2010 2011 2012 2013 2014 Book Value ($millions) Year
Double‐Declining Balance Switching to Straight‐Line
SLIDE 7
1 2 3 4 5 6 7 8 9 10 2004 2005 2006 2007 2008 2009 2010 2011 2012 2013 2014 Book Value ($millions) Year
Double‐Declining Balance Switching to Straight‐Line
SLIDE 8
1 2 3 4 5 6 7 8 9 10 2004 2005 2006 2007 2008 2009 2010 2011 2012 2013 2014 Book Value ($millions) Year
Double‐Declining Balance Switching to Straight‐Line
SLIDE 9
1 2 3 4 5 6 7 8 9 10 2004 2005 2006 2007 2008 2009 2010 2011 2012 2013 2014 Book Value ($millions) Year
Double‐Declining Balance Switching to Straight‐Line
SLIDE 10
1 2 3 4 5 6 7 8 9 10 2004 2005 2006 2007 2008 2009 2010 2011 2012 2013 2014 Book Value ($millions) Year
Double‐Declining Balance Switching to Straight‐Line
SLIDE 11
1 2 3 4 5 6 7 8 9 10 2004 2005 2006 2007 2008 2009 2010 2011 2012 2013 2014 Book Value ($millions) Year
Double‐Declining Balance Switching to Straight‐Line
SLIDE 12
1 2 3 4 5 6 7 8 9 10 2004 2005 2006 2007 2008 2009 2010 2011 2012 2013 2014 Book Value ($millions) Year
Double‐Declining Balance Switching to Straight‐Line
SLIDE 13
1 2 3 4 5 6 7 8 9 10 2004 2005 2006 2007 2008 2009 2010 2011 2012 2013 2014 2015 Book Value ($millions) Year
MACRS Depreciation