
SLIDE 1
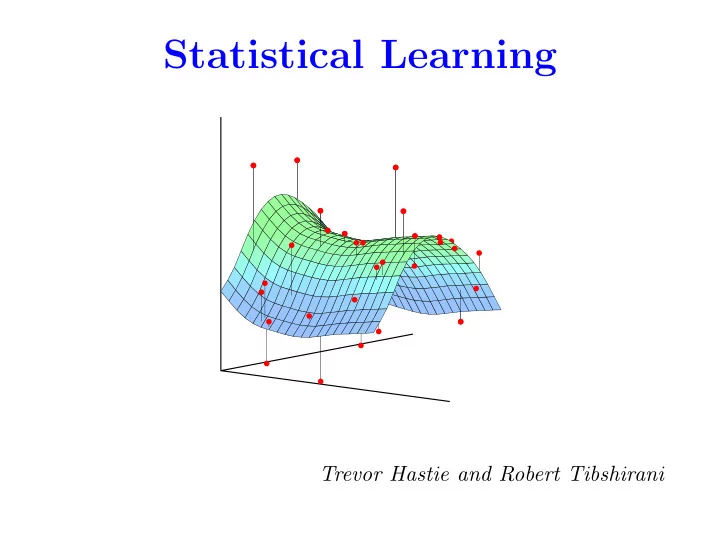
Statistical Learning
- •
- Trevor Hastie and Robert Tibshirani
Statistical Learning - - PowerPoint PPT Presentation
Statistical Learning
2 / 29
Enlarge This Image
Thor Swift for The New York Times
Carrie Grimes, senior staff engineer at Google, uses statistical analysis of data to help improve the company's search engine.
Multimedia
For TodayÕs Graduate, Just One Word: Statistics
By STEVE LOHR Published: August 5, 2009
MOUNTAIN VIEW, Calif. Ñ At Harvard, Carrie Grimes majored in anthropology and archaeology and ventured to places like Honduras, where she studied Mayan settlement patterns by mapping where artifacts were found. But she was drawn to what she calls Òall the computer and math stuffÓ that was part of the job. ÒPeople think of field archaeology as Indiana Jones, but much of what you really do is data analysis,Ó she said. Now Ms. Grimes does a different kind
where she uses statistical analysis of mounds of data to come up with ways to improve its search engine.
who are changing the image of the profession as a place for dronish number nerds. They are finding themselves increasingly in demand Ñ and even cool. ÒI keep saying that the sexy job in the next 10 years will be statisticians,Ó said Hal Varian, chief economist at Google. ÒAnd IÕm not kidding.Ó
N
Su
SIGN IN TO RECOMMEND SIGN IN TO E-MAIL PRINT REPRINTS SHARE
3 / 29
5 / 29
lpsa
−1 1 2 3 4
40 50 60 70 80
0.4 0.8
7.0 8.0 9.0
1 2 3 4
lweight
50 60 70 80
0.4 0.8
7.0 8.0 9.0
1 2 3 4 5
3.5 4.5
1 2
1 2 3
lpsa
1 3
60 80
0.4 0.8
7.5 9.0
4
lweight
4 5 6
1 2
0.4 0.8
1 2 3
7.0 8.0 9.0
4
4 5 6
1 2
1 2 3
80 0 20 60 100
pgg45
7 / 29
8 / 29
Frequency Log-periodogram 50 100 150 200 250 5 10 15 20 25
Phoneme Examples
aa ao
Frequency Logistic Regression Coefficients 50 100 150 200 250
0.0 0.2 0.4
Phoneme Classification: Raw and Restricted Logistic Regression
9 / 29
10 / 29
sbp
10 20 30
0.4 0.8
100
160 220
20 30
6 10 14
0.4 0.8
25 35 45
100
160 220
6 10 14
25 35 45
40 60 20 40 60
age 11 / 29
12 / 29
Average percentage of words or characters in an email message equal to the indicated word or character. We have chosen the words and characters showing the largest difference between spam and email.
13 / 29
14 / 29
15 / 29
16 / 29
17 / 29
18 / 29
20 40 60 80 50 100 200 300 Age Wage 2003 2006 2009 50 100 200 300 Year Wage 1 2 3 4 5 50 100 200 300 Education Level Wage
19 / 29
20 / 29
Spectral Band 1 Spectral Band 2 Spectral Band 3 Spectral Band 4 Land Usage Predicted Land Usage
Usage ∈ {red soil, cotton, vegetation stubble, mixture, gray soil, damp gray soil}
21 / 29
22 / 29
23 / 29
24 / 29
25 / 29
26 / 29
BellKor’s Pragmatic Chaos wins, beating The Ensemble by a
27 / 29
applications and prediction accuracy.
interpretability, and precision and uncertainty.
28 / 29
1
Springer Texts in Statistics
An Introduction to Statistical Learning
Gareth James Daniela Witten Trevor Hastie Robert Tibshirani with Applications in R
The course will cover most of the material in this Springer book (ISLR) published in 2013, which the instructors coauthored with Gareth James and Daniela Witten. Each chapter ends with an R lab, in which examples are developed. By January 1st, 2014, an electronic version of this book will be available for free from the instructors’ websites.
Springer Series in Statistics
Trevor Hastie Robert Tibshirani Jerome Friedman
The Elements of Statistical Learning
Data Mining,Inference,and Prediction Second Edition
This Springer book (ESL) is more mathematically advanced than ISLR; the second edition was pub- lished in 2009, and coauthored by the instructors and Jerome Friedman. It covers a broader range
Amazon, a free electronic version is available from the instructors’ websites.
29 / 29