
Statistical Analysis in the Lexis Diagram: Age-Period-Cohort models — and some cousins
Bendix Carstensen Steno Diabetes Center Copenhagen, Gentofte, Denmark http://BendixCarstensen.com European Doctoral School of Demography, Odense, April 2019
From /home/bendix/teach/APC/EDSD.2019/slides/slides.tex Monday 1st April, 2019, 13:12 1/ 332
Introduction
Bendix Carstensen
Statistical Analysis in the Lexis Diagram: Age-Period-Cohort models — and some cousins European Doctoral School of Demography, Odense,April 2019 http://BendixCarstensen/APC/EDSD-2019
intro
Welcome
◮ Purpose of the course:
◮ knowledge about APC-models ◮ technical knowledge of handling them ◮ insight in the basic concepts of analysis of rates ◮ handling observation in the Lexis diagram
◮ Remedies of the course:
◮ Lectures with handouts (BxC) ◮ Practicals with suggested solutions (BxC) ◮ Assignment for Thursday Introduction (intro) 2/ 332
Scope of the course
◮ Rates as observed in populations
— disease registers for example.
◮ Understanding of survival analysis (statistical analysis of rates)
— this is the content of much of the first day.
◮ Besides concepts, practical understanding of the actual
computations (in R) are emphasized.
◮ There is a section in the practicals:
“Basic concepts of rates and survival” — read it; use it as reference.
◮ If you are not quite familiar with matrix algebra in R, there is
an intro on the course homepage.
Introduction (intro) 3/ 332
About the lectures
◮ Please interrupt:
Most likely I did a mistake or left out a crucial argument.
◮ The handouts are not perfect
— please comment on them, prospective students would benefit from it.
◮ Time-schedule:
Two lectures (≈ 2 hrs)
- ne practical (≈ 1 hr)
Introduction (intro) 4/ 332
About the practicals
◮ You should use you preferred R-environment. ◮ Epi-package for R is needed, check that you have version 2.35 ◮ Data are all on the course website. ◮ Try to make a text version of the answers to the exercises —
it is more rewarding than just looking at output. The latter is soon forgotten — Rmd is a possibility.
◮ An opportunity to learn emacs, ESS and Sweave?
Introduction (intro) 5/ 332
Rates and Survival
Bendix Carstensen
Statistical Analysis in the Lexis Diagram: Age-Period-Cohort models — and some cousins European Doctoral School of Demography, Odense,April 2019 http://BendixCarstensen/APC/EDSD-2019
surv-rate
Survival data
◮ Persons enter the study at some date. ◮ Persons exit at a later date, either dead or alive. ◮ Observation:
◮ Actual time span to death (
“event” )
◮ . . . or . . . ◮ Some time alive (
“at least this long” )
Rates and Survival (surv-rate) 6/ 332
Examples of time-to-event measurements
◮ Time from diagnosis of cancer to death. ◮ Time from randomization to death in a cancer clinical trial ◮ Time from HIV infection to AIDS. ◮ Time from marriage to 1st child birth. ◮ Time from marriage to divorce. ◮ Time from jail release to re-offending
Rates and Survival (surv-rate) 7/ 332
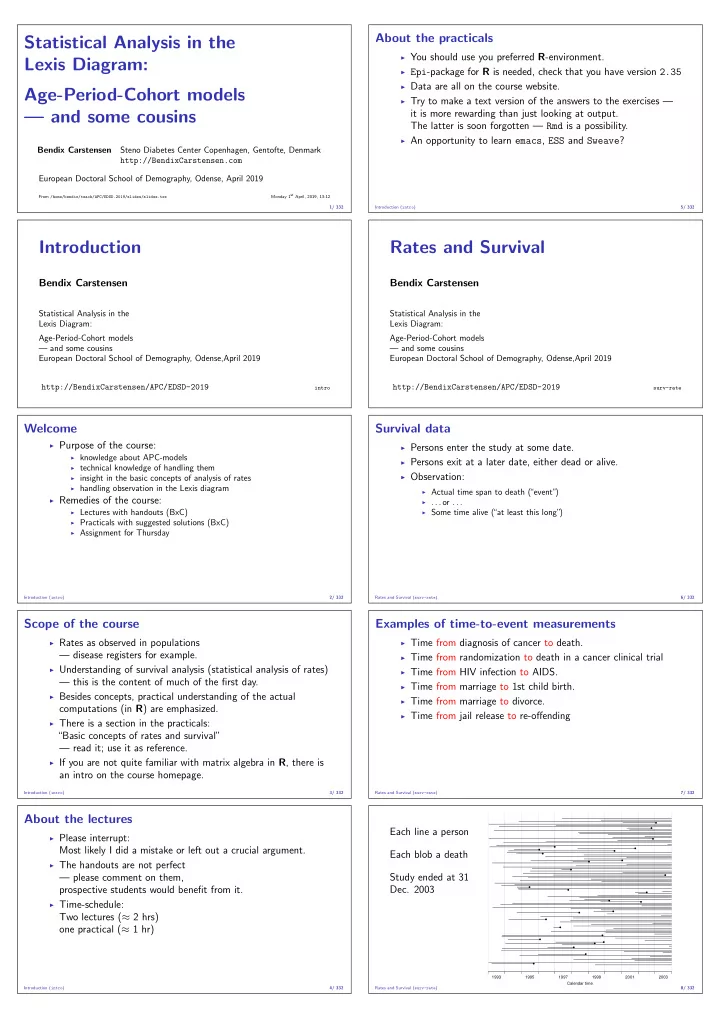
Each line a person Each blob a death Study ended at 31
- Dec. 2003
Calendar time
- 1993
1995 1997 1999 2001 2003 Rates and Survival (surv-rate) 8/ 332