
SLIDE 1
Page 1
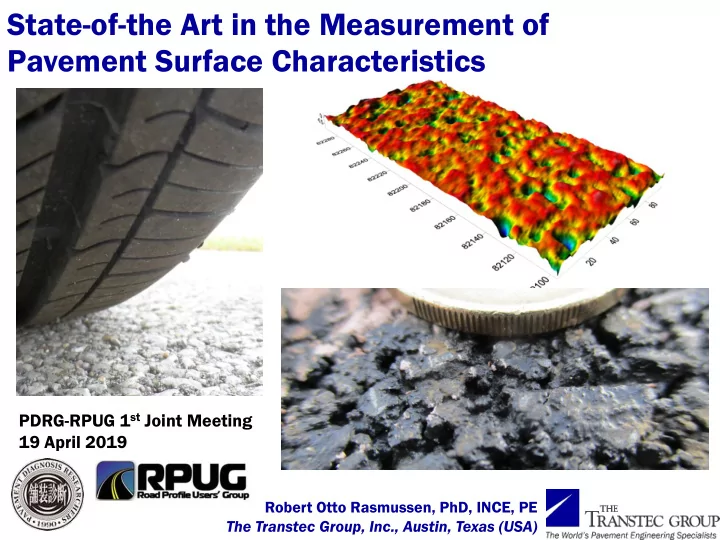
PDRG-RPUG 1st Joint Meeting 19 April 2019
State-of-the Art in the Measurement of Pavement Surface Characteristics
Robert Otto Rasmussen, PhD, INCE, PE The Transtec Group, Inc., Austin, Texas (USA)
State-of-the Art in the Measurement of Page 1 Pavement Surface - - PowerPoint PPT Presentation
State-of-the Art in the Measurement of Page 1 Pavement Surface Characteristics PDRG-RPUG 1 st Joint Meeting 19 April 2019 Robert Otto Rasmussen, PhD, INCE, PE The Transtec Group, Inc., Austin, Texas (USA) What are Pavement Surface
Page 1
PDRG-RPUG 1st Joint Meeting 19 April 2019
Robert Otto Rasmussen, PhD, INCE, PE The Transtec Group, Inc., Austin, Texas (USA)
Page 2
What are Pavement Surface Characteristics?
Page 3
Design Materials Construction Climate Traffic Maintenance Texture Porosity Stiffness Users & Society Noise Friction Splash & Spray
Evenness
Human Experience & Societal Demands Pavement Surface Characteristics Pavement Properties Factors
Foundation
What are Pavement Surface Characteristics?
Page 4
a) Construction quality for acceptance. b) Periodic testing of performance requirements (PPP / JEHDRA). c) Laws and regulations (noise, friction, fuel economy).
a) Asset management
Why do we Measure Pavement Surface Characteristics?
Page 5
Microtexture Macrotexture Megatexture 1mm 10mm 100mm 1m 10m Roughness 100mm 10mm 1mm 100m
1/8in.
1in. 1ft. 10ft. 100ft. 10mil 1mil 0.1mil
Rolling Resistance Ride Quality Wet Weather Friction Dry Weather Friction Tire Wear Vehicle Wear
In-Vehicle Noise
Tire-Pavement Noise Splash and Spray Good Bad
Key:
Texture Wavelength PIARC Category Pavement Surface Characteristic (PSC) Influence
Source: PIARC
Texture Classifications for Pavement Surface Characteristics
Page 6
Texture Classifications for Pavement Surface Characteristics
Page 7
Measuring “Profiles” with Straightedges
Page 8
Measuring Profiles with Inertial Profilers
Page 9
Measuring Profiles with Inertial Profilers
Page 10
Measurements of 3-D Profiles
Page 11
Calculating Evenness from Profiles: International Roughness Index (IRI)
Smoothest Automotive Proving Ground Smooth/New Highway “Average” Road “Poor” Ride “Unacceptable” Ride
Page 12
Viewing and Analyzing Profiles for Evenness
Page 13
Viewing and Analyzing Profiles for Evenness
Page 14
Viewing and Analyzing Profiles for Evenness
Page 15
Analyzing Profiles for Construction Defects
Page 16
Measuring Profiles in Real-Time during Construction
Page 17 Page 17
Measurements for Texture
Page 18
Measurements for Texture: Old, Worn Asphalt
Page 19
Measurements for Texture: Good, New Asphalt
Page 20 Page 20
100 200 300 400 500 600 700 800 900
Distance (m) Mean Profile Depth, MPD (mm)
Measurements for Texture: Variability in Surface Texture
Page 21 Page 21
Measurements for Texture: Variability in Surface Texture
Page 22
Measurements for Friction (Grip)
Page 23
Sandstone Slag Expanded Shale/Clay Granite Limestone Trap Rock Gabbro
A “cocktail” of aggregates can result in targeted grip levels. Also important to understand stability of grip with time.
Page 23
Grip Measurements for Improving Pavement Engineering
Page 24
Measurements for Tire-Pavement Interaction Noise
Page 25
Tire-Pavement Interaction Noise
Quietest pavement we have measured: Precast Porous Concrete located in the Netherlands
Page 26
Tire-Pavement Interaction Noise
Page 27
Predicting Tire-Pavement Interaction Noise from Texture
Page 28
1:1 Trendline R2 = 0.87 StdErr = 0.9 dBA 100 101 102 103 104 105 106 107 108 109 110 111 112 100 101 102 103 104 105 106 107 108 109 110 111 112 Measured Site Average OBSI Level (dBA) Texture-Predicted Site Average OBSI Level (dBA) Transverse Tining Longitudinal Tining Drag Diamond Grinding Transverse Tining OBSI = f (Ltx,160 , Ltx,25 , Rk,TR) Longitudinal Tining OBSI = f (Ltx,40) Diamond Grinding OBSI = f (Ltx,80+63+50+40 , SkewTR) Drag OBSI = f (Ltx,50+40 , SkewTR, Rk,TR)
+/- 1 dBA
Predicting Tire-Pavement Interaction Noise from Texture
Page 29
Measurements for Rolling Resistance
Page 30
Measurements for Rolling Resistance
Page 31
Measurements for Rolling Resistance
Improper use of vibratory roller introducing texture
Page 32
Texture Impacts on Rolling Resistance
Improper use of vibratory roller introducing texture
Page 33
Pavement Management
Page 34
Pavement Management
Page 35
Pavement Management
Page 36
Robert Otto Rasmussen, PhD, INCE, PE
The Transtec Group, Inc., Austin, Texas (USA) Robotto@TheTranstecGroup.com +1 (512) 680 8362