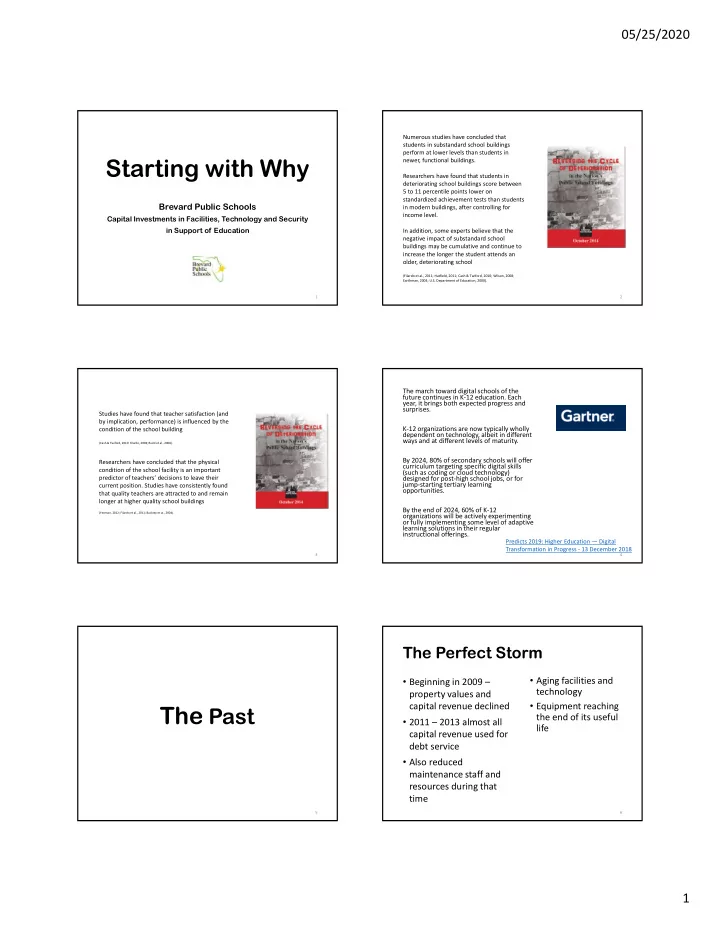
Starting with Why newer, functional buildings. Researchers have - - PDF document

starting with why
SMART_READER_LITE
LIVE PREVIEW

Starting with Why newer, functional buildings. Researchers have - - PDF document

05/25/2020 Numerous studies have concluded that students in substandard school buildings perform at lower levels than students in Starting with Why newer, functional buildings. Researchers have found that students in deteriorating school


slide-1
SLIDE 1

05/25/2020 1

Starting with Why

Brevard Public Schools

Capital Investments in Facilities, Technology and Security in Support of Education

1 2

Numerous studies have concluded that students in substandard school buildings perform at lower levels than students in newer, functional buildings. Researchers have found that students in deteriorating school buildings score between 5 to 11 percentile points lower on standardized achievement tests than students in modern buildings, after controlling for income level. In addition, some experts believe that the negative impact of substandard school buildings may be cumulative and continue to increase the longer the student attends an

  • lder, deteriorating school

(Filardo et al., 2011; Hatfield, 2011; Cash & Twiford, 2010; Wilson, 2008; Earthman, 2004; U.S. Department of Education, 2000). 3

Studies have found that teacher satisfaction (and by implication, performance) is influenced by the condition of the school building

(Cash & Twiford, 2010; Filardo, 2008; Rudd et al., 2008).

Researchers have concluded that the physical condition of the school facility is an important predictor of teachers’ decisions to leave their current position. Studies have consistently found that quality teachers are attracted to and remain longer at higher quality school buildings

(Yeoman, 2012; Filardo et al., 2011; Buckley et al., 2004).

The march toward digital schools of the future continues in K‐12 education. Each year, it brings both expected progress and surprises. K‐12 organizations are now typically wholly dependent on technology, albeit in different ways and at different levels of maturity. By 2024, 80% of secondary schools will offer curriculum targeting specific digital skills (such as coding or cloud technology) designed for post‐high school jobs, or for jump‐starting tertiary learning

  • pportunities.

By the end of 2024, 60% of K‐12

  • rganizations will be actively experimenting
  • r fully implementing some level of adaptive

learning solutions in their regular instructional offerings.

Predicts 2019: Higher Education — Digital Transformation in Progress ‐ 13 December 2018

4

The Past

5

The Perfect Storm

  • Beginning in 2009 –

property values and capital revenue declined

  • 2011 – 2013 almost all

capital revenue used for debt service

  • Also reduced

maintenance staff and resources during that time

  • Aging facilities and

technology

  • Equipment reaching

the end of its useful life

6

slide-2
SLIDE 2

05/25/2020 2 The 2014 Sales Surtax Concept

7

  • Original facility assessments done in spring/summer 2014
  • Basis of the sales surtax referendum
  • Systems rated 1 (failing) – 5 (almost new)
  • Estimates based on generalized costs
  • From this data base, developed “Attachment F” – funded

project – for each school

What was Funded?

8

Surtax Funding for Facility Renewal

Safety Code Deficiencies 7,020,395 $ 4% Mechanical (HVAC, plumbing) 106,764,617 $ 68% Building Envelope 21,125,267 $ 13% Electrical 18,150,754 $ 12% Site Utilities 3,908,967 $ 2% Facility Renewal Total 156,970,000 $

This represented about 22% of the identified facility renewal needs in 2014! Sales surtax revenue exceeded expectations. Facility renewal investment is now at about 25% of needs identified in 2014.

9

Surtax Funding for Educational Technology

This represented about 93% of the surtax related identified Technology Education needs in 2014! Technology Cabling 6,292,510 $ 25% Technology Equipment Renewal 11,177,953 $ 44% Classroom Technology Infrastructure 7,894,726 $ 31% Educational Technology Total 25,365,189 $ 100%

10 11 12

slide-3
SLIDE 3

05/25/2020 3

The Present

13 14 15

$45 million per year revenue (pre‐Covid); 228,88 households (July 1, 2018) – roughly $124/household per year paid in sales surtax

Business 23.4% Households 63.2% Tourists 13.4%

Contributions from General Revenue from Sales Tax (with CST*) Collections in FY 2017‐2018 by Source

Source: State of Florida Long‐Range Financial Outlook ‐ Fiscal Years 21‐23 ‐ September 2019

*Communications Services Tax

16 Month Revenue Cumulative August $1,294,012 $1,294,012 September $3,474,204 $4,768,216 October $3,440,101 $8,208,317 November $4,526,234 $12,734,551 December $3,425,373 $16,159,924 January $3,477,814 $19,637,738 February $5,470,970 $25,108,708 March $3,471,004 $28,579,712 April $3,505,366 $32,085,078 May $5,389,791 $37,474,869 June $3,554,107 $41,028,976 July $3,574,694 $44,603,670 August $4,954,442 $49,558,112 September $3,474,204 $53,032,316 October $3,440,101 $56,472,417 November $4,526,234 $60,998,651 December $3,425,373 $64,424,024 January $3,477,814 $67,901,838 February $5,420,075 $73,321,913 Total $73,321,913

Estimated based on prior year receipts ‐ not adjusted for COVID‐19 impacts

Projected Revenue over $198 Million

Pre-Covid Projection

17

Basis of Post-Covid Projection

2020 2021 2022 2023 2024 2025 2026 2027 January 0.75 0.825 0.85 0.875 0.9 0.925 0.95 February 0.75 0.825 0.85 0.875 0.9 0.925 0.95 March 0.80 0.825 0.85 0.875 0.9 0.925 0.95 April 0.80 0.825 0.85 0.875 0.9 0.925 0.95 May 1.00 0.80 0.825 0.85 0.875 0.9 0.925 0.95 June 0.60 0.80 0.825 0.85 0.875 0.9 0.925 0.95 July 0.60 0.80 0.825 0.85 0.875 0.9 0.925 0.95 August 0.65 0.80 0.825 0.85 0.875 0.9 0.925 0.95 September 0.65 0.80 0.825 0.85 0.875 0.9 0.925 0.95 October 0.70 0.80 0.825 0.85 0.875 0.9 0.925 0.95 November 0.70 0.80 0.825 0.85 0.875 0.9 0.925 0.95 December 0.70 0.80 0.825 0.85 0.875 0.9 0.925 0.95 Coefficients applied against CY 2019 revenue stream to estimate future revenue Assume significant revenue decline June, July due to April, May COVID impacts Assumes increasing revenue during recovery from COVID to about 80% of prior economic activity Assumes about 3% annual increase moving forward 18

slide-4
SLIDE 4

05/25/2020 4

Month Revenue Cumulative August $1,294,012 $1,294,012 September $3,474,204 $4,768,216 October $3,440,101 $8,208,317 November $4,526,234 $12,734,551 December $3,425,373 $16,159,924 January $3,477,814 $19,637,738 February $5,470,970 $25,108,708 March $3,471,004 $28,579,712 April $3,505,366 $32,085,078 May $5,389,791 $37,474,869 June $2,132,464 $39,607,333 July $2,144,816 $41,752,150 August $3,220,387 $44,972,537 September $2,258,233 $47,230,770 October $2,408,071 $49,638,840 November $3,168,364 $52,807,204 December $2,397,761 $55,204,965 January $2,486,865 $57,691,830 February $4,065,056 $61,756,886 Total $61,756,886

Estimated based on prior year receipts ‐ adjusted for COVID‐19 impacts

Projected Revenue over $198 Million

Post-Covid Projection

19

Covid Impacts to Current Surtax

Pre‐covid projection over $198 million 73,321,913 $ Post‐covid projection over $198 million 61,756,886 $ Estimated reduction in revenue 11,565,027 $ Received through April 2020 32,085,078 $ Allocated to date Facility renewal 23,025,000 $ Educational technology 2,000,000 $ Security 10,012,275 $

20

Total: $193,513,117

21

Total: $20,816,637

22

Project Facility Name Construction Schedule Status

1

Ocean Breeze Elementary Summer 2015 Closed

2

Cape View Elementary Summer 2016 Closed

3

Delaura Middle Summer 2015, 2016, 2017 Closed

4

Audubon Elementary Summer 2015, 2016 Closed

5

Andersen Elementary Summer 2015, 2017 Closed

6

Jefferson Middle Summer 2016 Closed

7

Roosevelt Elementary Summer 2016 Closed

8

Sea Park Elementary Summer 2016 Closed

9

Tropical Elementary Summer 2016 Closed

10

Palm Bay Elementary Summer 2015, 2016 Closed

11

Discovery Elementary Summer 2016 Closed

12

Oak Park Elementary Summer 2015, 2016 Closed

13

Saturn Elementary Summer 2017 Closed

14

Melbourne High Summer 2017 Closed

15

Sabal Elementary Summer 2017 Closing 6/16

16

Hoover Middle Summer 2017 Closing 6/16

17

Turner Elementary Summer 2017 Closed

18

Fairglen Elementary Summer 2017 Closed

19

Apollo Elementary Summer 2017 Working on close out – Audit underway

20

McLarty Stadium

Pending 21

Stone Middle Summer 2017, 2019 Closed

22

Pinewood Elementary Summer 2017 Working on close out – Audit underway

23

West Melbourne Elementary Summer 2017 Closed

24

Jackson Middle Summer 2017 Working on close out – Audit underway

25

Sherwood Elementary Summer 2017 Closed

26

Kennedy Middle Summer 2017 Closed

27

Croton Elementary Summer 2018 Closed

28

Southwest Middle Summer 2017 Closed

23

Project Facility Name Construction Schedule Status

29

Rockledge High Summer 2018 Closed

30

Williams Elementary Summer 2018 Closing 6/16

31

Lewis Carroll Elementary Summer 2016, 2019

  • Closed. Additional HVAC scope summer 2019 complete

32

Cocoa High Summer 2018, 2019 Substantially complete. Building 18 ongoing. GMP 2 audited.

33

Mid‐South Area Support

34

Mila Elementary Summer 2018 Closed

35

Golfview Elementary Summer 2018 Closed

36

Creel Elementary Summer 2018 Closed

37

Coquina Elementary Summer 2018 Close out to Board 2/25

38

Holland Elementary Summer 2019 Working on close out

39

Lockmar Elementary Summer 2019 Working on close out. Chiller refurbishment underway.

40

Johnson Middle Summer 2019 Working on close out

41

University Park Elementary Summer 2019 Working on close out

42

Madison Middle Summer 2019 Working on close out

43

Stevenson Elementary Summer 2019 Closed

44

Roy Allen Elementary Summer 2016, 2019

  • Closed. Additional HVAC scope summer 2019 complete

45

Quest Elementary Summer 2019 Working on close out

46

Eau Gallie High Summer 2019 Working on close out

47

Gemini Elementary Summer 2019 Closed

48

Endeavour Elementary Summer 2016, 2019

  • Closed. Additional HVAC scope summer 2019 complete

49

Port Malabar Elementary Summer 2019 Closed

50

South Lake Education Center Summer 2018 Closed

51

Indialantic Elementary Summer 2019 Working on close out

52

Surfside Elementary Summer 2019 Working on close out

53

Atlantis Elementary Summer 2019 Closing 5/26

54

Clearlake Education Center Summer 2019 Added scope summer 2020

55

Harbor City Elementary Summer 2019 Working on close out

56

West Shore Jr./Sr. High (Revised) Summer 2018, 2019 Working on close out

57

Westside Elementary Summer 2017 Closed

58

520 Compound Scoping work with Transportation

24

slide-5
SLIDE 5

05/25/2020 5

Project Facility Name Construction Schedule Status 59 McNair Magnet Summer 2020 Under construction 60 Whispering Hills Funding Reallocated to Contingency 61 Cambridge Elementary Summer 2020 Under construction 62 Longleaf Elementary Summer 2020 Under construction 63 Edgewood Jr./Sr. High Planned Summer 2020 Under construction 64 Freedom 7 Elementary Summer 2016 Closed ‐ audit not required. ET work under construction 2020 65 Meadowlane Primary Summer 2020 Under construction 66 Space Coast Jr./Sr. High Summer 2020 Under construction 67 Suntree Elementary Summer 2020 Under construction 68 Jupiter Elementary Summer 2020 Under construction 69 Gardendale Summer 2020 GMP pending 70 Manatee Elementary Summer 2020 Under construction 71 Challenger 7 Summer 2020 Under construction 72 Titusville High School Summer 2020 Under construction 73 Riviera Elementary Summer 2020 Under construction 74 Cuyler On hold ‐ pending decision on sale of facility 75 North Area Transportation Under construction 76 Merritt Island Summer 2020 Under construction 77 Columbia Elementary Summer 2020 Under construction 78 Central Middle Summer 2018/2019/2020 Surtax scope done. New central energy plant (capital) 2020 79 Cocoa Beach Jr./Sr. High Summer 2020 Under construction 80 Palm Bay High Summer 2020 Under construction 81 South Area Head Start Summer 2020 Under construction 82 Satellite High Summer 2020 Under construction 83 Imperial Estates Elementary Summer 2020 Under construction 84 McAuliffe Elementary Summer 2020 Under construction 85 Plant Operations/Maintenance Paving done. Additional work planned 86 Enterprise Elementary Summer 2020 Under construction 87 South Pine Grove Summer 2020 Under construction 88 Astronaut High Summer 2020 Under construction 89 West Shore Jr./Sr. High (Original) Summer 2018, 2019 Working on close out 90 Mims Elementary Summer 2020 Under construction 91 Educational Services Facility Windows & gutters done. Design underway ‐ HVAC and doors 92 Meadowlane Intermediate Summer 2020 Under construction 93 Viera High Summer 2020 Under construction 94 Riverview School Under construction 95 Westside Bus Compound Scoping work with Transportation 96 Sunrise Elementary Summer 2020 Under construction 97 Bayside High Summer 2017/2020 HVAC scope done, building envelope scope summer 2020 98 Manatee Bus Compound Scoping work with Transportation 99 Satellite Bus Compound Scoping work with Transportation 100 Heritage High Hold Pending evaluation of chilled water pipe repairs 101 Melbourne Bus Compound Scoping work with Transportation

25

Educational Technology Accomplishments

Technology Cabling Rockledge High Atlantis Elementary Meadowlane Primary Melbourne High Central Middle Bayside High (2020) Williams Elementary (2020) Equipment Renewal Computers > 6 years 7,194 Servers > 8 years 597 Switches > 8 years 701 Telephone > 15 years 5,928 Wireless Access Points 1,220 Classroom Technology Infrastructure Concurrent with facility renewal projects

26

Security Accomplishments

  • Original program completed early and enhanced

27

Despite this level of effort and investment…

  • Sales surtax program only addressed about 25% of

facility renewal needs identified in 2014

  • Building systems, equipment deteriorate over time
  • Demand for current technology and security

increasing

  • Classroom renewal was excluded in 2014 surtax

program

28

The Future

29

Data-Driven Approach

  • Facility Assessment – 70% Complete
  • Classroom Condition Assessment – 60% Complete
  • Security Assessment – Complete
  • Technology Asset Management ‐ Ongoing
  • Ancillary Assessments
  • Athletic facilities – assessed in 2018
  • Playgrounds – assessed in 2020

30

slide-6
SLIDE 6

05/25/2020 6

Source ‐ State of Our Schools ‐ 21st Century School Fund; U.S. Green Building Council (USGBC), The Center for Green Schools; National Council on School Facilities (NCSF) ‐ 2016 31

Facility Assessment

Direct Costs ‐ 70% done Pro Rate to 100% Add 50% Indirect Roof 51,328,021 $ 73,325,744 $ 109,988,616 $ Building 5,806,290 $ 8,294,700 $ 12,442,050 $ HVAC 8,063,131 $ 11,518,759 $ 17,278,138 $ Electrical 8,351,363 $ 11,930,518 $ 17,895,778 $ Plumbing 1,959,580 $ 2,799,400 $ 4,199,100 $ 75,508,385 $ 107,869,121 $ 161,803,682 $ Summary to date of priority 1 and 2 needs. These are the recommended priorities through year 2 only.

32

Facility

Priority School P/Highly Monitored HM/Title 1 T/Both B

Paint condition Cabinet Condition Floor Condition Floor Material (carpet C, tile T, mixed M) Furniture Lighting (LED done D or not done N) Classroom Doors condition

Classroom Doors (internal I, external E, mixed M) Media Center

Condition Index Average Comments Delaura 3 1.5 2.5 T 1.6 N 0.5 M Shared see SHS 1.82 Wood doors falling apart through campus. Creel P/T 3.1 1.2 2 1.8 N 2.03 Building 2 carpet replaced in 2019 Jackson 2.9 1.1 3 M 2.5 N 0.5 M 2.7 2.12 Media Carpet should be replaced. Science labs need work West Melbourne 2.7 0.8 1.6 T 2.6 N 3 M 2.5 2.2 Discovered active termite & termite damage in the 400 wing. Custodial service notified. Cabinets need to be replaced Sea Park 2.2 1.1 1.3 M 3 N 3 M 2.8 2.23 Floors are uneven in several rooms. Cabs in bad shape Holland 2.5 3 0.9 M 3 N 2.8 I 2.9 2.52 Carpet is well beyond its shelf life. Media Center could use new carpet. Doors need paint Roosevelt 2.8 2.4 2.4 T 2.6 N 2 M 2.9 2.52 Surfside 2.8 1.8 2.3 T 3 N 2.9 M 2.4 2.53 Croton T 2.8 1.9 3 T 2.9 N 1.8 M 2.8 2.53 Media carpet should be replaced Ocean Breeze 2.8 3 2.9 T 2.7 N 2.1 M 1.8 2.55 Some old CT floors are buckling

Excerpt from Classroom Assessment

Plan to address worst conditions first Needs vary widely by school and component condition Not all schools/classrooms need renewal Generalized estimate ‐ 4,200 classrooms at $15,000 per classroom ‐ $63 million

33

Classroom Photos

Saturn – right Creel – top left

34

Security Assessment

Highest Priority Secondary Priority Total Physical Measures 14,906,704 $ 5,511,575 $ 20,418,279 $ Technology 8,785,080 $ 20,763,290 $ 29,548,370 $ Equipment 711,500 $ ‐ $ 711,500 $ Total 24,403,284 $ 26,274,865 $ 50,678,149 $

These are direct costs only. Add 50% for indirect costs

35

Educational Technology

36

slide-7
SLIDE 7

05/25/2020 7

Educational Technology Needs

Technology Cabling and Building Infrastructure 9,245,780 $ Data Closets 12,581,855 $ Wireless Access Points 2,458,620 $ Computers 6,406,656 $ Modern Classrooms 1,116,534 $ Network‐Cyber Security 870,000 $ Total 32,679,445 $

37

Other Capital Needs

  • Athletic facility renewal
  • Playground renewal
  • Hardcourt renewal
  • Pavilion renewal
  • Parking renewal and traffic/pedestrian circulation

improvements

38

Other Drivers

  • Marjory Stoneman Douglas Public Safety

Commission

  • Unprecedented security investment
  • COVID‐19
  • Current and likely future driver for more educational

technology assets

  • May drive need for facility capital investments
  • May drive need for school bus capital investments

39

By the Numbers

  • Local Capital Improvement (LCI) Revenue
  • About $69 million FY 21 – increasing 3‐5% annually
  • Obligations of LCI
  • Debt service ‐ $36‐38 million annually
  • Property insurance – about $5 million annually
  • Maintenance support – over $10 million annually
  • Current revenue less obligations leaves about $18‐19

million for all other capital – busses, ET, security, other facility renewal

  • Industry best practices ‐ facilities:
  • Maintenance – 3% ‐ $60 million
  • Periodic renewal – 2% ‐ $40 million
  • Reduction of deferred maintenance – 1% ‐ $20 million

40

By the Numbers

  • At $45 million annually (sales surtax)
  • Slowly addressing years of deferred maintenance
  • But still haven’t addressed some major systems
  • Roof renewal
  • Classroom renewal
  • Deferred maintenance will still grow
  • Initial surtax – only addressed condition codes 1 and 2
  • Building systems, equipment continue to deteriorate with time
  • Issues are replicated in ET and Security
  • Limited plan for sustainability over time
  • Lower priority assets degrade to failure – then cost

more to replace

41

Bottom Line

  • Facility renewal deficit identified in 2014 only 25%

addressed by current surtax

  • Current facility assessment validates significant

unfinished renewal needs

  • Many classrooms are in poor condition
  • Additional security needs identified
  • Educational technology needs increasing
  • High demand for other capital resources
  • High degree of uncertainty for estimates

42

slide-8
SLIDE 8

05/25/2020 8

Revenue Estimates

2019 2020 2021 2022 2023 2024 2025 2026 2027 January $3,315,820 $3,477,814 $2,486,865 $2,735,552 $2,818,447 $2,901,343 $2,984,238 $3,067,134 $3,150,029 February $5,420,075 $5,470,970 $4,065,056 $4,471,562 $4,607,064 $4,742,566 $4,878,068 $5,013,569 $5,149,071 March $3,315,493 $3,471,004 $2,652,394 $2,735,282 $2,818,169 $2,901,056 $2,983,944 $3,066,831 April $3,355,854 $3,505,366 $2,684,683 $2,768,580 $2,852,476 $2,936,372 $3,020,269 $3,104,165 May $5,389,791 $5,389,791 $4,311,833 $4,446,578 $4,581,322 $4,716,067 $4,850,812 $4,985,557 June $3,554,107 $2,132,464 $2,843,286 $2,932,138 $3,020,991 $3,109,844 $3,198,696 $3,287,549 July $3,574,694 $2,144,816 $2,859,755 $2,949,123 $3,038,490 $3,127,857 $3,217,225 $3,306,592 August $4,954,442 $3,220,387 $3,963,554 $4,087,415 $4,211,276 $4,335,137 $4,458,998 $4,582,859 September $3,474,204 $2,258,233 $2,779,363 $2,866,218 $2,953,073 $3,039,929 $3,126,784 $3,213,639 October $3,440,101 $2,408,071 $2,752,081 $2,838,083 $2,924,086 $3,010,088 $3,096,091 $3,182,093 November $4,526,234 $3,168,364 $3,620,987 $3,734,143 $3,847,299 $3,960,455 $4,073,611 $4,186,766 December $3,425,373 $2,397,761 $2,740,298 $2,825,933 $2,911,567 $2,997,201 $3,082,836 $3,168,470 Annual Total $47,746,188 $39,045,041 $6,551,921 $31,208,234 $39,390,605 $40,584,260 $41,777,915 $42,971,569 $44,165,224 $8,299,100 Charter allocation percent (historically increasing by 1% per year) 10% 11% 12% 13% 14% 15% 16% Less charter allocation $3,120,823 $4,332,967 $4,870,111 $5,431,129 $6,016,020 $6,624,784 $1,327,856 Net to BPS $28,087,411 $35,057,639 $35,714,149 $36,346,786 $36,955,550 $37,540,440 $6,971,244 Cumulative (BPS) $28,087,411 $63,145,049 $98,859,198 $135,205,984 $172,161,533 $209,701,974 $216,673,218 Cumulative (Charter) $3,120,823 $7,453,790 $12,323,901 $17,755,030 $23,771,050 $30,395,833 $31,723,689 Cumulative (Total) $31,208,234 $70,598,840 $111,183,099 $152,961,014 $195,932,583 $240,097,807 $248,396,907 Estimate of remaining sales surtax revenue in current program Estimate of sales surtax renewal receipts Assumptions: Prior projections year to year growth about 3% COVID impacts starting with June 2020 revenue

43

How to Invest $216 Million?

Roof renewal Classroom renewal Electrical renewal HVAC renewal Plumbing renewal Technology cabling Technology equipment Classroom technology Cybersecurity Security Intercoms Playground renewal Parking renewal Athletic facility renewal Hardcourt renewal Pavillion renewal/replacement Roof renewal Classroom renewal Electrical renewal HVAC renewal Plumbing renewal Technology cabling Technology equipment Classroom technology Cybersecurity Security Intercoms Playground renewal Parking renewal Athletic facility renewal Hardcourt renewal Pavillion renewal/replacement

44

Next Steps

  • Board consideration of Resolution 2020‐02 authorizing

renewal on the November 2020 ballot – June 16

  • 6 years
  • Independent Citizens Oversight Committee
  • Similar investment strategy
  • Facility renewal
  • Educational technology
  • Security
  • Transmit Resolution to the County Commission
  • Board member feedback on investment priorities
  • Staff compiles assessment data and prepares

recommendations for investments at each facility

45

Impact

  • Connection to learning
  • Facilities and educational technology matter to teaching

and learning

  • Preserving our assets – changing the paradigm
  • Fixing only failures is at the expense of preserving the

good

  • Replacing/repairing at failure significantly more

expensive than preventive maintenance

  • Investment in the community
  • Since 2015 – almost $200 million has been locally

invested in construction

46 47