
SLIDE 1
3-2.1
Spiral 3-2
Signal & Image Processing
3-2.2
SIGNAL AND IMAGE PROCESSING
Finding and exploiting patterns in raw data
3-2.3
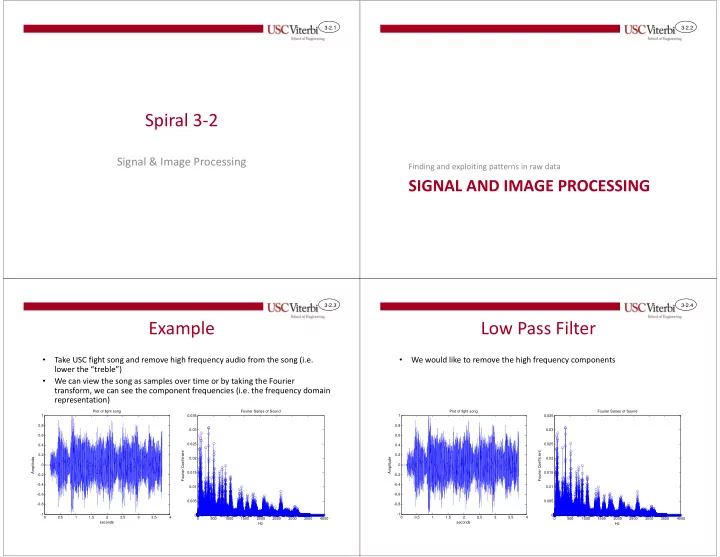
Example
- Take USC fight song and remove high frequency audio from the song (i.e.
lower the “treble”)
- We can view the song as samples over time or by taking the Fourier
transform, we can see the component frequencies (i.e. the frequency domain representation)
0.5 1 1.5 2 2.5 3 3.5 4
- 1
- 0.8
- 0.6
- 0.4
- 0.2
0.2 0.4 0.6 0.8 1 Plot of fight song seconds Amplitude 500 1000 1500 2000 2500 3000 3500 4000 0.005 0.01 0.015 0.02 0.025 0.03 0.035 Fourier Series of Sound Hz Fourier Coefficient
3-2.4
Low Pass Filter
- We would like to remove the high frequency components
0.5 1 1.5 2 2.5 3 3.5 4
- 1
- 0.8
- 0.6
- 0.4
- 0.2
0.2 0.4 0.6 0.8 1 Plot of fight song seconds Amplitude 500 1000 1500 2000 2500 3000 3500 4000 0.005 0.01 0.015 0.02 0.025 0.03 0.035 Fourier Series of Sound Hz Fourier Coefficient