
SLIDE 1
SPH Corporate Presentation Disclaimer This presentation is for - - PowerPoint PPT Presentation
SPH Corporate Presentation Disclaimer This presentation is for information only and does not constitute an invitation or offer to acquire, purchase or subscribe for shares in SPH ( Shares ) . The value of shares and the income derived from
This presentation is for information only and does not constitute an invitation or offer to acquire, purchase or subscribe for shares in SPH (“Shares”). The value of shares and the income derived from them may fall as well as rise. Shares are not obligations of, deposits in, or guaranteed by, SPH or any of its affiliates. An investment in Shares is subject to investment risks, including the possible loss of the principal amount
presentation may also contain forward-looking statements that involve risks and uncertainties. Actual future performance, outcomes and results may differ materially from those expressed in forward-looking statements as a result of a number of risks, uncertainties and assumptions. Representative examples of these factors include (without limitation) general industry and economic conditions, interest rate trends, cost of capital and capital availability, competition from similar developments, shifts in expected levels of property rental income, changes in operating expenses, including employee wages, benefits and training, property expenses and governmental and public policy changes and the continued availability of financing in the amounts and the terms necessary to support future business. You are cautioned not to place undue reliance on these forward- looking statements, which are based on current view of management on future events. This presentation shall be read in conjunction with SPH’s financial results for the quarter ended 30 November 2019 in the SGXNET announcement.
2
3
platforms since 1984
editions; also has online classifieds, radio stations and outdoor
and advertisers’ changing needs; including platforms such as FastJobs, sgCarMart
leverage on synergies and explore new areas of growth
develop more digital content
4
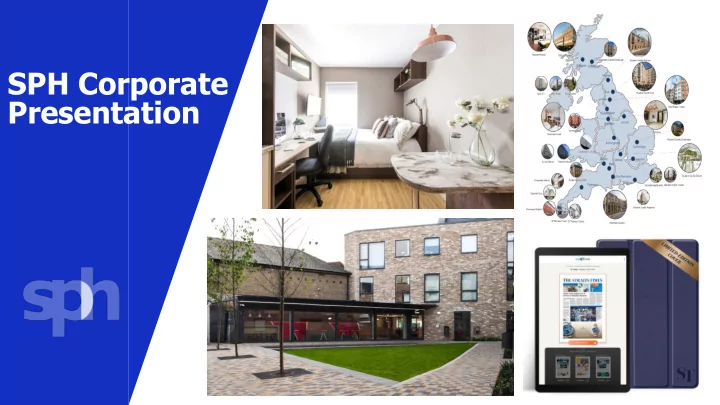
7,726 beds in 28 assets across 18 Cities in UK and Germany
Kajima Development
5
stake in Westfield Marion Shopping Centre for A$670m
acquiring 2,383 beds and premium Student Castle brand
proceeds of S$164.5m
6
Operating revenue down due to media decline, mitigated by higher revenue from property
Total Costs up 6.1%
enlarged PBSA portfolio and SPH REIT
Media Segment of S$7.2m S$10.5m FV gain on investment property due to Mayflower student housing portfolio price adjustment Share of results of associates boosted by M1 contribution Operating profit increasingly supported by recurring income from Property
7
1Q FY20 S$’000 1Q FY19 S$’000
Change
% Operating revenue 243,983 254,316 (4.1) Total Costs 195,073 183,914 6.1 Operating profit# 53,944 74,841 (27.9) FV change on investment prop. 10,527
Share of results of associates, JVs (762) (2,435) (68.7) Investment income 4,549 3,182 43.0 Profit before taxation 68,258 75,588 (9.7) Net profit attributable to shareholders 46,333 55,929 (17.2)
#
This represents the recurring earnings of the media, property and other businesses. NM: Not Meaningful
8
1Q FY19 Media Property Others incl. Aged Care, Exhibitions 1Q FY20
162.1 68.0 24.2 140.1 80.9 23.0 Property-related revenue set to rise with SPH REIT, Student Castle additions
S$’m
9
1Q FY19 Media Others incl Aged Care, M1 1Q FY20
32.3 39.8 3.5 7.5 55.0 5.8
*One-off retrenchment costs
S$’m
Property
10
Telecommunications Technology
20 40 60 80 100 120 140 160
The Business Times Lianhe Zaobao Lianhe Wanbao Shin Min Berita Harian/ Berita Minggu Tamil Murasu/ Tamil Murasu Sunday
1Q FY20 (Digital) 1Q FY20 (Print) 1Q FY19 (Digital) 1Q FY19 (Print)
100 200 300 400 500 600 700 800
Total
11
50 100 150 200 250 300 350 400 450
The Straits Times/ The Sunday Times
Daily Average Newspaper Circulation ’000
The Straits Times News Tablet latest to launch on 18 Dec 2019
Berita Harian
Jan, 75% are new
Jan, 86% are new
13.0 14.3 13.8 14.8 14.6 14.5 14.0 15.3 16.2
2 4 6 8 10 12 14 16 1Q FY18 2Q FY18 3Q FY18 4Q FY18 1Q FY19 2Q FY19 3Q FY19 4Q FY19 1Q FY20
Annual Digital Ad Revenue*
S$’m
13.0 14.6 16.2
5 7 9 11 13 15 17 1Q FY18 1Q FY19 1Q FY20
Quarterly Digital Ad Revenue*
S$’m
Total: S$55.9m
12
Digital ad revenue shows an 11.6% CAGR since 1Q FY2018
steadily at 8.8% y-o-y
11.6% CAGR
*Total digital ad revenue from ads, online classifieds, magazines and other digital portals (excluding ShareInvestor)
Total: S$58.4m
Faster digital revenue growth at 13.6% CAGR
1Q FY19
13
20.2 21.3 24.9 29.6
10 20 30 1Q FY17 1Q FY18 1Q FY19 1QFY20
Quarterly Digital Revenue*
S$’m
*Total digital revenue from circulation, ads, online classifieds, magazines and other digital portals (excluding Shareinvestor)
13.6% CAGR
Leveraging Zaobao brand to build
Nov 2019, first time held
14
Quality Journalism
Media Awards 2019
Radio listenership up*
(*Based on half yearly Nielsen Radio Diary Survey)
15
Revamped ZB Classified
e.g. editorial
15.4% y-o-y
0.0% 5.0% 2Q FY19 3Q FY19 4Q FY19 1Q FY20
Display Classified* Newspaper Ad
% Y-o-Y Change in Print Ad Revenue
Expanding outdoor business
Raffles Place
Board at Ocean Financial Centre with ‘happiness meter’ to draw eyeballs
* Classified includes Recruitment and Notices
16
Qoo10 merged with India’s ShopClues in Nov 2019
ShopClues platform
electronics and lifestyle items across India
Target Media seals key HDB tender
screens to HDB estates by June 2020
17
Paragon S$2.75b Clementi Mall S$597m
SPH REIT
The Rail Mall S$63.8m UK Student Accommodation (100%) >S$1.5b Woodleigh Mall and Residences (50%) S$400m Figtree Grove (85%) A$175m The Seletar Mall (70%) S$347m SPH REIT
in Asia-Pacific PBSA
brand
capabilities Continue seeking out cash-yielding investments in defensive sectors to grow recurring income base
18
Westfield Marion (50%) A$670m German Student Accommodation (100%) S$23.4m
19
Feb 2019 116 beds | 1 asset Lincoln Mayflower Portfolio Sep 2018 3,436 beds | 14 assets Bristol, Birmingham London, Sheffield Huddersfield Plymouth Mar 2019 264 beds | 2 assets Glasgow Apr 2019 1,243 beds | 3 assets Southampton Sheffield Leeds Nov 2019 284 beds | 1 asset Bremen (Germany)
Student Castle Dec 2019
2,383 beds | 7 assets York, Cambridge Bath, Edinburgh Durham Brighton, Oxford (in dev.)
£448m Student Castle deal to add S$22.6m PBT (proforma)
PBSA to date:
>S$1.5b portfolio 7,726 Beds 28 assets 18 Cities 2 Countries
20
Cambridge: 212 beds SBR: 1.3 Rank: 2 Oxford: 515 beds SBR: 1.4 Rank: 1
Bath: 183 beds SBR: 2.6 National Rank: 332 Durham: 473 beds SBR: 2.1 Rank: 51 York: 648 beds SBR: 2.0 Rank: 211 Edinburgh: 146 beds SBR: 2.6 Rank: 121 Brighton: 206 beds SBR: 3.8 National Rank: 612
ranked Russell Group of universities
@
* The Times Higher Education World University Rankings
1 The Complete University Guide, University League Tables, Russell Group 2 CWUR World University Rankings @ Oxford and Brighton are under development
21
Top of the range student brand a competitive advantage
wifi, 24/7 security, fully-equipped gym, bike storage
international and domestic students
Full-suite operational capabilities for better efficiency and economies of scale
22
Extends UK network significantly
university cities, including Oxford and Cambridge
with Russell Group universities
Figure within the circle represents the number of assets in each city
* Represents cities where Russell Group universities are located; Russell Group is a ranking of the top 24 UK universities
Student Castle Portfolio Capitol Students Portfolio 1
23
Diversifying into Bremen, Germany with S$23.4m freehold asset in Nov 2019
has one of largest student populations in Europe with >30% increase over the past decade
24
Acquired 50% interest in Westfield Marion Shopping Centre in Adelaide for A$670m
South Australia
attracts 13.5 million visitors annually
Continue to seek opportunities in Asia-Pacific retail properties
25
26
Improving operational efficiency
and ancillary services; lower manpower costs
Quality-focused with no notable care incidents reported Expanding at home and overseas
Ramping up re-opened Changi Care Village
Outdoor area for rehabilitation
* Excluding Changi Care Village which recently re-opened
27
Senior living assets are cash- yielding, defensive in nature: Japan
Bridge C Capital in Oct 2019 as on-ground partner
income
Other developed markets
Elderly population in Japan forecasted to rise
Group Pte Ltd
Carlyle Group (Buyout Team) at Carlyle Japan LLC
estate investment and financing from Accenture, ORIX Corporation, LaSalle Investment Management Co. Limited and Shinsei Bank Limited
28
29
Media, Telco & Tech
with targeted campaigns
management
journalism and innovation
Property
to >S$1.5b
grow recurring income base
Aged Care
efficiency
Leveraging on Balance Sheet Strength; Improving Recurring Income
Visit www.sph.com.sg for more information
53.5% 22.3% 24.2% Display Classified* Magazines & Others
* Classified includes Recruitment and Notices
38.6% 13.7% 33.2% 14.5% Advertisements (Media) Circulation Rental & Services Other revenue
Media Advertisement Revenue Composition (S$94.4m) Operating Revenue Composition (S$244.0m)
32
S$’ m Newsprint 2.8 Other Production costs 1.8 Staff Costs 2.1 Premises Costs 0.7 Depreciation 3.4 Other Operating Expenses 12.1 Finance costs 2.4
33
4.3% 12.2% 43.4% 9.7% 5.1% 18.6% 6.7% Newsprint Other Materials, Production & Distribution Cost Staff Cost Premises Cost Depreciation Other Operating Expenses Finance Cost
1Q FY20 Operating Expenditure* Cost Composition (S$194.5m)
* Excluding impairment charges
34
18.8% 19.0% 24.8% 37.4% Equities Bonds Investment Funds Cash, deposits and receivables*
Group Investible Fund (S$879m) as at 30 Nov 2019
include part of the proceeds from S$300m 4% Perpetual Securities issued in Nov 2019
purchase of short-term treasury bills using the proceeds from the Perpetual Securities
618 669 665 621 583 4,341 3,855 4,057 3,877 3,553 3,500 3,600 3,700 3,800 3,900 4,000 4,100 4,200 4,300 4,400 4,500 500 525 550 575 600 625 650 675 1Q FY19 2Q FY19 3Q FY19 4Q FY19 1Q FY20 LHS - Prices / MT RHS - Avg Mthly Consumption US$ / MT MT
Average Newsprint Charge-Out Price & Monthly Consumption
35
36
1Q FY20 1Q FY19 1Q FY18 % Change (1Q FY20 vs 1Q FY19) % Change (1Q FY20 vs 1Q FY18) Headcount as at end Nov 3,990 4,084 4,302 (2.3) (7.3) Staff Costs (S$’000) 84,405 86,489 85,794 (2.4) (1.6)
0% 5% 10% 15% 20% 25% 30% 35% 40% 45% 50% 20 40 60 80 100 1Q 2016 1Q 2017 1Q 2018 1Q 2019 1Q 2020 S$'m
Operating Profit and Operating Margin (%) *
Operating Profit Operating Margin
37 * Excluding impairment charges on goodwill and intangibles, and property, plant and equipment
99 71 70 75 54 33.4% 25.4% 26.9% 29.4% 22.1%