Speed is an important risk factor A comprehensive and unified Many - - PDF document

speed is an important risk factor a comprehensive and
SMART_READER_LITE
LIVE PREVIEW

Speed is an important risk factor A comprehensive and unified Many - - PDF document

Speed is an important risk factor A comprehensive and unified Many road safety measures seek to influence the number framework for analysing the and severity of accidents by influencing speed impacts on road safety of Is it possible to


slide-1
SLIDE 1

A comprehensive and unified framework for analysing the impacts on road safety of measures influencing speed

31st ICTCT workshop, Porto, Portugal, October 25 and 26, 2018 Rune Elvik, Institute of Transport Economics (re@toi.no)

Page

Speed is an important risk factor

Many road safety measures seek to influence the number and severity of accidents by influencing speed Is it possible to develop a single framework, or a unified approach, for the analysis of the effects of such measures? Potentially relevant measures include:

Changes in speed limits Changes in enforcement (type and intensity) Changes in fixed penalties (particularly for speeding) Penalty points or other treatment of speeding drivers Vehicle technology, especially ISA

2 Page

Some key concepts

Comprehensive:

The approach is applicable for all measures influencing speed The approach can deal with all relevant speed parameters (mean, variance, skewness, etc)

Unified:

The approach utilises the same types of data in all analyses The approach can be applied both to the speed of traffic and to individual driver speed

Framework:

The definition of the key elements of the approach

3 Page 4

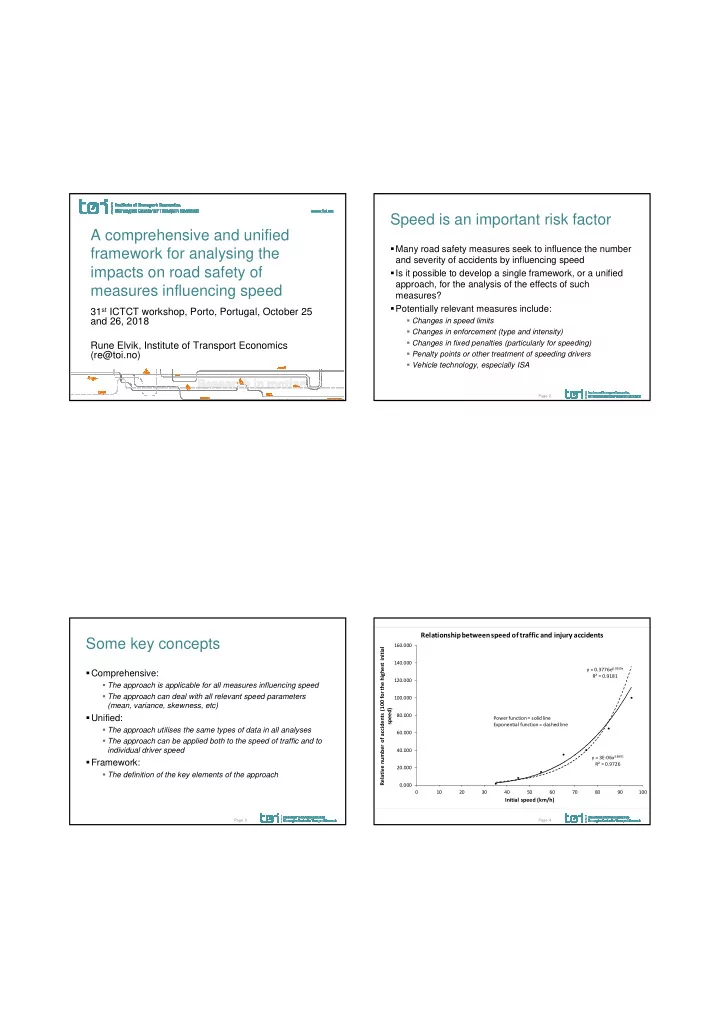
y = 0.3776e0.0619x R² = 0.9181 y = 3E-06x3.8601 R² = 0.9726 0.000 20.000 40.000 60.000 80.000 100.000 120.000 140.000 160.000 10 20 30 40 50 60 70 80 90 100 Relative number of accidents (100 for the highest initial speed) Initial speed (km/h)

Relationship between speed of traffic and injury accidents

Power function = solid line Exponential function = dashed line

slide-2
SLIDE 2

Page 5

y = 0.0032e0.0678x R² = 0.776 y = 3E-08x3.8814 R² = 0.783 0.00 0.10 0.20 0.30 0.40 0.50 0.60 0.70 0.80 0.90 1.00 10 20 30 40 50 60 70 80 90 Probability of accident Speed (kilometres per hour)

Relationship between a driver's speed and probability of accident involvement (Kloeden et al. 1997)

Page 6

4 5 30 57 133 205 127 34 6 2 1 1 5 25 79 148 168 115 48 12 2

50 100 150 200 250 35 40 45 50 55 60 65 70 75 80 85 Number of drivers Speed (km/h)

Actual speed distribution of control drivers (Kloeden et al. 1997) compared to normal distribution

Actual Normal

Page

The framework (case 80 km/h)

7

Share of Mean Relative Relative Relative Interval traffic speed fatality rate serious injury rate slight injury rate 3 to 2.5 below 0.6 56.3 0.21 0.30 0.45 2.5 to 2 below 1.7 59.9 0.27 0.38 0.52 2 to 1.5 below 4.4 63.5 0.36 0.47 0.60 1.5 to 1 below 9.2 67.1 0.49 0.58 0.70 1 to 0.5 below 15.0 70.7 0.65 0.72 0.81 0.5 to 0 below 19.1 74.3 0.87 0.90 0.93 0 to 0.5 above 19.1 77.9 1.15 1.11 1.07 0.5 to 1 above 15.0 81.5 1.54 1.38 1.24 1 to 1.5 above 9.2 85.1 2.05 1.72 1.43 1.5 to 2 above 4.4 88.7 2.74 2.13 1.66 2 to 2.5 above 1.7 92.3 3.65 2.64 1.91 2.5 to 3 above 0.6 95.9 4.87 3.28 2.21

Page

Data needed

The mean speed of traffic Either standard deviation or some statistic from which standard deviation can be estimated, like 85th fractile of speed distribution Estimates of the relationship between speed and risk of injury In the example, the exponential model was applied:

Coefficient 0.08 for fatal injury Coefficient 0.06 for serious injury Coefficient 0.04 for slight injury

8

slide-3
SLIDE 3

Page

Divide and conquer

Assume that speed has a normal distribution Divide the distribution into twelve intervals, each spanning

  • ne half standard deviation

Estimate the share of traffic in each interval Estimate mean speed in each interval Set relative risk equal to 1 at the mean speed Compute relative risk in each interval, relying on the exponential model The risk in each interval is the risk to drivers driving at the speeds comprised by that interval

9 Page

A very flexible framework

The framework can handle the following types of changes:

A reduction in speed across the whole distribution A larger reduction of the highest speeds than the lowest A reduction of speed variance A truncation of the speed distribution at the speed limit (effect of ISA) A dose-response curve for police enforcement The deterrent effect of increased fixed penalties

Examples of how to use the framework follow

10 Page 11

0.1 0.2 0.3 0.4 0.5 0.6 0.7 0.8 0.9 1 20 40 60 80 100 120 Cumulative distribution Speed (km/h)

Speed distributions for speed limits 80 and 70 km/h in Norway

76.1 68.3

Page

An example

12

Share of Old New Change in Old relative New relative Interval traffic speed speed fatality rate fatality rate fatality rate 3 to 2.5 below 0.6 56.3 53.5 0.80 0.21 0.16 2.5 to 2 below 1.7 59.9 56.2 0.74 0.27 0.20 2 to 1.5 below 4.4 63.5 58.9 0.69 0.36 0.25 1.5 to 1 below 9.2 67.1 61.6 0.64 0.49 0.31 1 to 0.5 below 15.0 70.7 64.3 0.60 0.65 0.39 0.5 to 0 below 19.1 74.3 67.0 0.56 0.87 0.48 0 to 0.5 above 19.1 77.9 69.7 0.52 1.15 0.60 0.5 to 1 above 15.0 81.5 72.4 0.48 1.54 0.74 1 to 1.5 above 9.2 85.1 75.1 0.45 2.05 0.92 1.5 to 2 above 4.4 88.7 77.8 0.42 2.74 1.14 2 to 2.5 above 1.7 92.3 80.5 0.39 3.65 1.41 2.5 to 3 above 0.6 95.9 83.2 0.36 4.87 1.76 Weighted sum 1.18 0.59

slide-4
SLIDE 4

Page 13

1.106 1.037 1.000 0.967 0.925 0.868 0.000 0.200 0.400 0.600 0.800 1.000 1.200 0.60 0.70 0.80 0.90 1.00 1.10 1.20 1.30 1.40 1.50 1.60 Change in rate of speeding (1.00 = no change; 0.80 = 20 % reduction; 1.20 = 20 % increase) Change in risk of apprehension (1.00 = no change; 0.80 = 20 % reduction; 1.20 = 20 % increase)

Driver adaptation to changes in police enforcement (model estimated)

Current risk of apprehension Current level of speeding

Page

Application to speed model

14

Share of Contribution Compliance Revised Interval traffic Speed to fatalities modification contribution 3 to 2.5 below 0.6 56.3 0.001 1.000 0.001 2.5 to 2 below 1.7 59.9 0.005 1.000 0.005 2 to 1.5 below 4.4 63.5 0.016 1.000 0.016 1.5 to 1 below 9.2 67.1 0.045 1.000 0.045 1 to 0.5 below 15.0 70.7 0.097 1.000 0.097 0.5 to 0 below 19.1 74.3 0.165 1.000 0.165 0 to 0.5 above 19.1 77.9 0.221 1.000 0.221 0.5 to 1 above 15.0 81.5 0.231 1.000 0.231 1 to 1.5 above 9.2 85.1 0.189 0.777 0.147 1.5 to 2 above 4.4 88.7 0.121 0.777 0.094 2 to 2.5 above 1.7 92.3 0.062 0.768 0.048 2.5 to 3 above 0.6 95.9 0.029 0.768 0.022 Weighted sum 1.182 1.092 Sum 1-3 above 0.401 0.311

Page

Conclusions

To accurately estimate the effects on road safety of changes in speed, it is useful to model speed distributions A default assumption is that speed follows a normal distribution, but the model can accommodate other distributions The risk assumed at each level of the speed distribution should reflect the mean individual risk of drivers driving at that speed Effects on individual driver risk and on the total number of accidents or injuries can then be integrated and made consistent

15