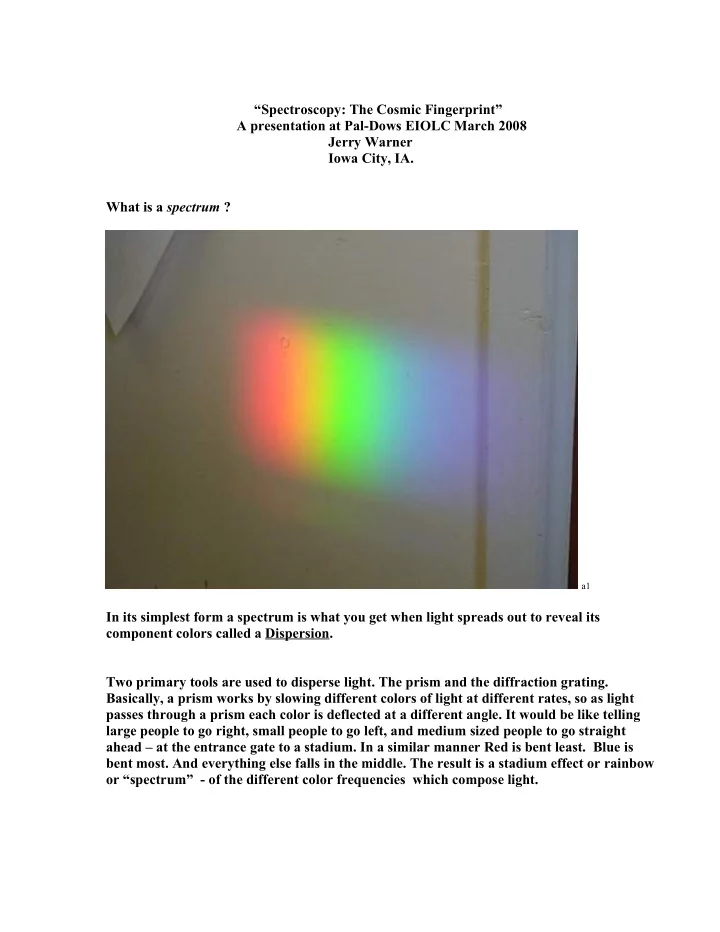
SLIDE 1 “Spectroscopy: The Cosmic Fingerprint” A presentation at Pal-Dows EIOLC March 2008 Jerry Warner Iowa City, IA. What is a spectrum ? a1 In its simplest form a spectrum is what you get when light spreads out to reveal its component colors called a Dispersion. Two primary tools are used to disperse light. The prism and the diffraction grating. Basically, a prism works by slowing different colors of light at different rates, so as light passes through a prism each color is deflected at a different angle. It would be like telling large people to go right, small people to go left, and medium sized people to go straight ahead – at the entrance gate to a stadium. In a similar manner Red is bent least. Blue is bent most. And everything else falls in the middle. The result is a stadium effect or rainbow
- r “spectrum” - of the different color frequencies which compose light.
SLIDE 2 a2 A diffraction grating works exactly the same way as a prism except many small prisms are etched into a piece of glass and instead of one spectrum a whole series of spectra are
- created. But the principle is the same.
a3
SLIDE 3
We still need to know what a spectrum is, on a more basic level. Without that knowledge we cannot tell what spectra like these mean or if they have anything in common. a4 Spectra are the result of activity in matter. Specifically the electrons which cycle back and forth between fixed energy states above the nucleus of an atom, and as they move through the weak atomic plasma small electromagnetic shock waves called photons are created. One wavelength of these shock waves or photons is visible light which we see, but there is a whole Continuum of electromagnetic photons which we need special apparatus to see. The whole continuum of electromagnetic waves is called the Electromagnetic Spectrum: A5 <chart emc> Matter is divided into small energy packets called Atoms. Each atom consists of a nucleus surrounded by a series of electron shells which convey energy in and out of the atom. It is the cycling behavior of electrons between energy states or orbits above the nucleus that is responsible for the production of light and features in a spectrum. A6<chart shells>
SLIDE 4
a7 The chart above illustrates a typical atom and its energy shells surrounding the nucleus. Notice how particular energy shells are associated with specific color frequencies of light. It is the activity of electrons cycling between specific energy states that releases photons with a specific electromagnetic wavelength as well as other features, all of which appear as features in different spectra. <spectra a8)>
SLIDE 5
Let me give some perspective on this matter: On the scale of our daily lives the atom is so small as to be invisible while the universe is so large as to be beyond imagination. If you take a proton which comprises the nucleus of a hydrogen atom and made that proton 12 feet wide the electron by comparison would be only slightly larger than the point of a pin (1 pixel square) - at a distance of some 18 miles from the proton. This is the scale we are talking about inside the typical atom. This does not mean the atom is empty space – far from it. The space between the nucleus and the electrons is filled with a myriad of activity and sub-atomic particles coming and going. But the electron has plenty of room inside the atom to cycle back and forth between a very large number of energy states, and the electrons must adjust as the atom absorbs or emits energy. That is how close the connection is between what occurs within an atom and the traits we see as a spectrum. These spectral traits tell us what is going on in the atoms that comprise matter which in turn tells the objects themselves and their environment. <a9 shells and lines> <a9a> (1) If a substance contains many kinds of atoms in a stable active state at an even temperature, the combined affect of all of the electrons moving around will emit a continuous spectrum of color frequencies. A continuous spectrum is the backdrop for most stellar conditions against which other features are added or subtracted. In this case the electrons in
SLIDE 6 the various atoms are emitting at a steady rate, being fed by a steady supply of energy and holding to an even temperature, emitting photons evenly across the full range of color frequencies, as with a glowing light bulb! Our Sun is also one such emitter. b1 (2) If enough energy is applied to an atom then electrons will emit their energy by dropping to a lower energy states closer to the nucleus. Each transition produces a spectral line. The photons produced show as bright lines called an Emission spectrum. These bright lines correspond to the energy states that were involved in the transaction
- f electrons being charged at one energy level and dropping to a lower energy shell.
b2 We encounter emission spectra like this only in cases where high temperatures and high energies are involved, as in a Neon light or in a Wolf Rayet star glowing at 50,000 degrees Kelvin, or when a star explodes creating a super nova or a white dwarf collapses at hundreds of thousands or even millions of degrees. Here are a few emission spectra for elements on the Periodic table. <periodic spectra > b3
SLIDE 7 Each element on the Period table has its own unique emission spectrum. If we took all of the elements in the Periodic Table and burned them in a lab one at a time each Element would produce a unique emission spectrum. This is exactly how a catalog of spectra were assembled for cross comparison, analysis, and comparing with the spectra of stars et
- cetera. It is in this manner we have a built up our knowledge of the chemical and material
makeup of Nature. There is one more major type of spectrum: (3) If an atom absorbs energy then we see dark absorption lines (or gaps) in the spectrum. An atom is a highly integrated assembly and sensitive to its environment. When an atom absorbs energy from outside its electrons must move to higher energy states. For example if a layer of hydrogen at the surface of a star absorbs photons traveling up from the center
- f the star, then we would be a blank in the spectrum of light from the surface of the star
representing a Hydrogen absorption line in the spectrum of that star. Or if light is blocked by a cool cloud of hydrogen gas surrounding a star, then we would also expect a dark hydrogen absorption line in the light from that star if the star’s light makes it through the diffuse cloud surrounding it. The chart below shows the absorption condition. b4 Once again, the wavelength of the spectral line involved is the ‘difference between the energy States’ the electron transitioned between. Here is how this works:
SLIDE 8
Recall our image of the shells of an electron. The frequency of an emission or absorption line is roughly equal to the difference between the energy states that are involved. That is: Freq = [eNx] – [eNy]/ 300,000 m.sec <chart b5 > Stated in words this says, the energy value of State-x minus energy value of State-y, divided by the speed of light. This is a simple straightforward relationship which enhances the notion of just how unified and ‘quantised’ energy states are in the atom, where electrons can reside and move between energy states thus helping preserve the integrity of an atom. It is important to understand that the lines in an emission spectrum are identical To the lines in an absorption spectrum for the same element, because transitions between the same energy shells are involved in both cases. This makes things a lot easier. We can Look for absorption or emission lines in the same places along a spectral line and when We find either we know the same element is involved. Here’s an example – <b6a> In this case the lines are all hydrogen lines. Ha at 6563 angstroms in the red through H delta at 4101 angstroms in the violet. Here is a chart of the three major types of spectra is below –
SLIDE 9 Let’s look at a solar spectrum. b6 <solar spectrum> On quick inspection Sunlight reveals many absorption lines, but not emission lines because the sun is a Stable emitter at a constant low temperature of only about 6000K. The dark absorption lines are caused when photons working up from deep layers in the Sun encounter the opaque cooler mass at the Chromospheric surface of the Sun. During an eclipse however we do see several emission lines from the hot “coronal plasma region ” of the sun which extends out from the Sun and glows at about 1.7million degrees
- Kelvin. 6000 degrees at the surface and 1.7million degrees in the corona. This high
temperature more than satisfies the conditions for stripping electrons off their nucelii and creating an emission spectrum from charged electrons. Amateur astronomers Robin Leadbeater and Robert Fosbury have recently captured the emission lines from the Corona, during the eclipses of 2002 and 2006. Both recorded the rare Helium and and Iron (Fe) lines in their spectra. <robin eclipse spectrum> b7
SLIDE 10
The next step is to build up a catalog of spectral traits enough to compare with the spectra from stars and other sources. Spectroscopy not only applies to astronomy but to every area where chemistry and physics and matter is involved, including criminology and archaeology! <period chart> Using spectra like these we then compare our standardized Periodic spectra with the spectra of cosmic objects (just as Joseph Fraunhofer did in the 1860s) and finally after cataloging many elements and many cosmic spectra we can begin to build a synopsis and classification system. Here is a comparison with our solar spectrum. <b8 comparison periodic w sol> In the comparison shown note how prolific Fe (Iron) lines are in the solar spectrum. The H-lines of hydrogen are the same Balmer series lines we spoke of earlier. Although it does not appear very bright visually, the Sun’s strongest single emission is at 6563.4 angstroms, the H alpha Balmer line marked above. Once at least two lines have been identified on a spectrum then the spectrum can be tentatively calibrated which in turn can lead to the identification of further lines on the spectrum.
SLIDE 11 By now millions of stars have been photographed and classified as to their spectral type. The classification system we use today was developed at the University of Chicago at Yerkes Observatory and is called the Morgan-Keenan System, or the MK system for short. The Morgan-Keenan system starts with seven basic Star types arranged according to temperature and surface gravity. Here is a photographic plate from the original Morgan-Kennan catalog which was used to help build the MK chart. <b9 mk orig plate> <c1 mk chart> <MAYBE REPLACE WITH MY OWN MK CHART WITH BETTER SPECTRA> Looking at the chart above several things are apparent:
- All of the spectra above show absorption lines with a Continuous background.
- There are no hot emission lines in the above.
- We see a shift in energy from the blue to the red from O to M.
- The shift in energy is a function of temperature.
- Line structure changes from O to M and by M we are seeing broad absorption
bands in addition to lines.
- The spectra above show a change in atomic makeup from O through M.
SLIDE 12
- Some absorption lines representing certain atomic elements can be traced
across classes, O-M, but some lines vanish to be replaced by new lines or bands.
- The above stellar spectra show lines which we know are associated with
specific elements like hydrogen, He, Fe, Ca, Na, Oxygen and H2O.
- There is a definite association of lines with temperature across stellar classes.
Traits we can hope to measure using a spectrum include: Spectral light from an object can tell you:
- The Chemical Composition
- The Temperature
- The Velocity along the line of sight
- Pressure
- Gravity
- Magnetism
- Structural properties
- Number of objects
- Environmental & weather factors
- History
- Physics issues involved
- Etc.
One parting thought: Stars and other celestial objects are so distant from Earth it is unlikely we or even our ancestors will ever visit very many of them. This is something I used to worry
SLIDE 13
about as a child searching for my own identity as a war orphan afterWWII . I am not a person who likes limitations! Much later I learned these same cosmic objects, or at least pieces of them, travel to us every day, by way of their photons! In some cases we are collecting and studying actual pieces of these objects, so all is not lost. None of us knows where this story will all end but whatever it will be, spectroscopy will play a vital role and very likely we and our future descendants will visit far more objects at extreme distances, than we had earlier anticipated. Because in a very real sense nature has provided the path for our doing so – Thank you for your attention tonight. After a break we will welcome Gary Clinch of Grinnel and his presentation. Jerry Warner (March 08)