
SLIDE 1
Sources of Bry and Iy in the TTL & LS: Constraints from recent DOAS aircraft observations of BrO and IO
1. Instrumentation 2. TORERO & CONTRAST measurements of BrO and IO 3. Relevance: Tropospheric halogens impact O3 lifetime,
- xidize mercury and HOx over
the full tropical air column. 4. Bry sources: Sea-salt, VSL, aerosol chemistry/dynamics?
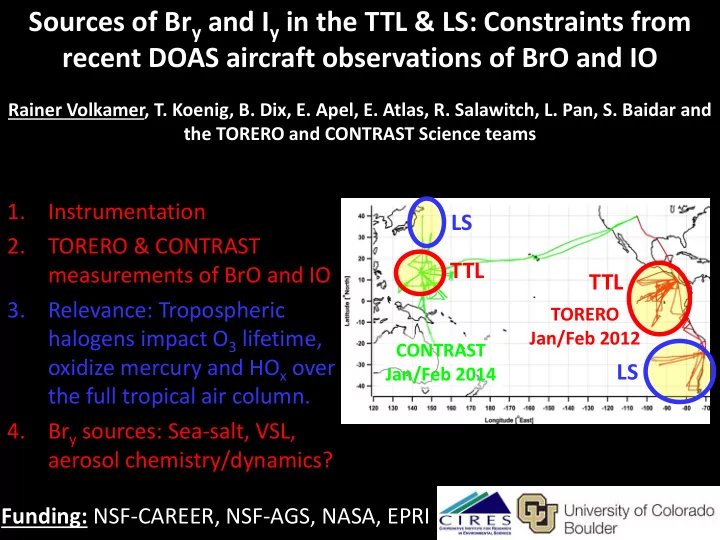
Rainer Volkamer, T. Koenig, B. Dix, E. Apel, E. Atlas, R. Salawitch, L. Pan, S. Baidar and the TORERO and CONTRAST Science teams TORERO Jan/Feb 2012 CONTRAST Jan/Feb 2014