
SLIDE 1
ICTP Winter College on Applications of Optics and Photonics in Food Science 1
Spectrometer Assembly
Connect raspberry pi to the screen: Connect pins on the touchscreen using the jumper cables, and the connector using the white ribbon cable. The blue strip of the ribbon cable should face the black tab on the
- connector. Be gentle with the ribbon cable and the tab as they can be quite delicate.
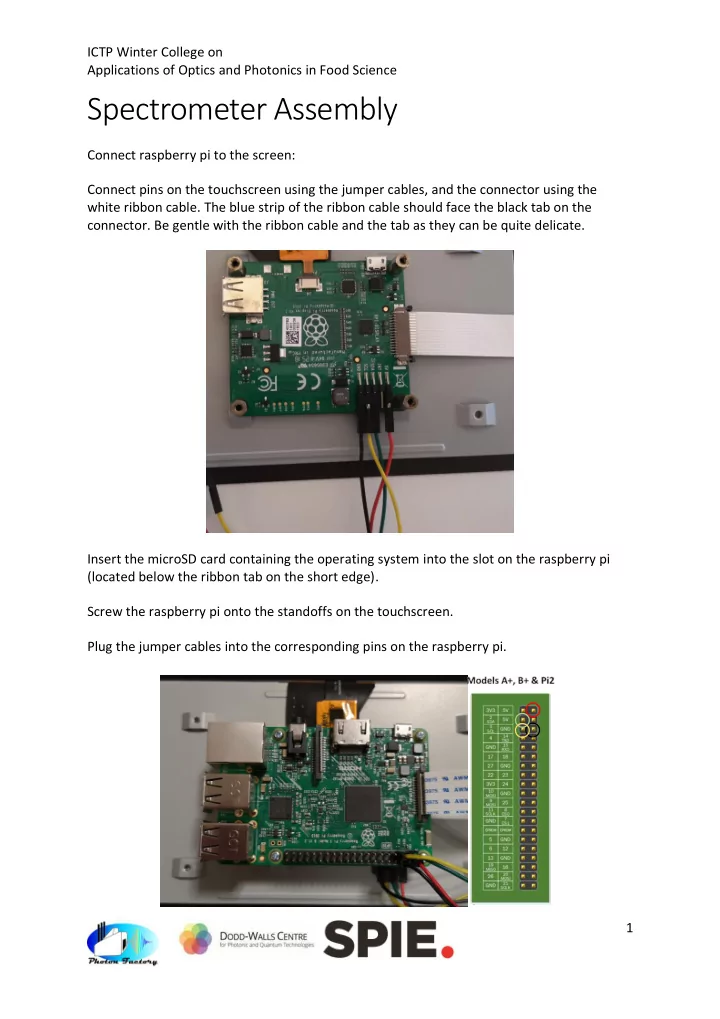
Insert the microSD card containing the operating system into the slot on the raspberry pi (located below the ribbon tab on the short edge). Screw the raspberry pi onto the standoffs on the touchscreen. Plug the jumper cables into the corresponding pins on the raspberry pi.