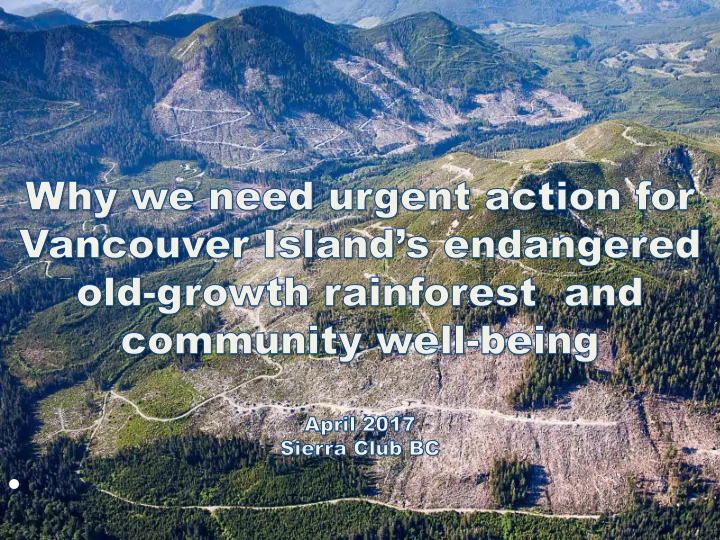
- Source: UK gov Global responsibility: Canada has more trees - - PowerPoint PPT Presentation

source uk gov global responsibility canada has more trees
SMART_READER_LITE
LIVE PREVIEW

- Source: UK gov Global responsibility: Canada has more trees - - PowerPoint PPT Presentation

- Source: UK gov Global responsibility: Canada has more trees per person than any other nation 150 million hectares deforestation 100 million hectares degradation (8%) (Canada: 21%, higher than any other country) November


slide-1
SLIDE 1
slide-2
SLIDE 2
slide-3
SLIDE 3
  • Source: UK gov
slide-4
SLIDE 4

Global responsibility: Canada has more trees per person than any other nation

slide-5
SLIDE 5
  • 150 million hectares deforestation
  • 100 million hectares degradation (8%)

(Canada: 21%, higher than any other country)

November 2013

slide-6
SLIDE 6
slide-7
SLIDE 7

http://cispatm.pbworks.com/f/temperate_rainforest_map.png

Temp emperate rai ainforests cov

  • ver abo

bout 0.5 .5% of lan and mas ass

slide-8
SLIDE 8
slide-9
SLIDE 9
slide-10
SLIDE 10

“Recovery of old growth forest is now an inappropriate, anachronistic concept, given rapid climate change, system unpredictability and scientific uncertainty.” BC ecologist Jim Pojar 2016

slide-11
SLIDE 11
slide-12
SLIDE 12

Rainforest trends (loss of primary forest)

Primary forest loss in tropical rainforest countries:

  • Overall decline of 10 percent in the last 25 years

(from 1990 to 2015, FAO). Vancouver Island

  • Overall decline of 30 per cent in the last 25 years
  • riginal extent: 2,600,000 hectares

1990: 1,082,000 hectares 2015: 748,000 hectares current rate: 9,000 ha/year or 25 ha/day

Primary forest: characterized by ecological processes largely undisturbed by human activity

slide-13
SLIDE 13
slide-14
SLIDE 14
slide-15
SLIDE 15
slide-16
SLIDE 16

Global Forest Carbon Density

  • R. Naidoo, A. Balmford, R. Costanza, B. Fisher, R. E. Green, B. Lehner, T. R. Malcolm, and T. H. Ricketts. Global mapping of ecosystem

services and conservation priorities. PNAS July 15, 2008 vol. 105 no. 28 9495-9500. http://www.pnas.org/content/suppl/2008/07/07/0707823105.DCSupplemental/0707823105SI.pdf

slide-17
SLIDE 17

NASA Tree Height Map

slide-18
SLIDE 18

Wood products can be climate friendly, but...

slide-19
SLIDE 19
slide-20
SLIDE 20
slide-21
SLIDE 21

Summary of eddy flux studies conducted in old-growth forests

Sink Source

Unpublished meta-analysis of 21 eddy flux studies (9 boreal, 7 temperate, 5 tropical)

Carbon flux (Mg C ha-1 y-1) 0.2 2.0 4.0

slide-22
SLIDE 22
slide-23
SLIDE 23
slide-24
SLIDE 24
slide-25
SLIDE 25

April 10, 2017

slide-26
SLIDE 26
slide-27
SLIDE 27
slide-28
SLIDE 28

Source: EBM Handbook, CIT

slide-29
SLIDE 29

Remaining Good+Medium OG 25%, protected 8%, Good, low, flat OG 9%, protected 4%

slide-30
SLIDE 30
slide-31
SLIDE 31
  • Very high ecological risk for old-growth ecosystems
  • Questionable economic benefit of status quo

logging in light of negative impacts for tourism, salmon, water, carbon, worsening climate impacts (droughts, floods)

  • BC economy less dependent on resource industry

(e.g. tourism now $16 billion, 16% + visitors 2016)

  • First Nations rights, new conservation options
  • Growing support for protection (UBCM, business, unions...)
  • EBM/GBR solution elements can be applied in other regions
slide-32
SLIDE 32

Sierra Club recommendations for improved forest management

  • Maintain natural, resilient forest ecosystems and reduce

carbon emissions

  • Support forestry operations and value added businesses that

create a higher number of jobs per tree

  • Restore government funding for stewardship, monitoring,

enforcement, inventories and research

  • Adjust the Annual Allowable Cut
  • Assist forestry dependent communities to restore healthy

forests and forestry opportunities as part of a diverse economy

slide-33
SLIDE 33
  • Support First Nations aspirations towards protection of intact

valleys in Clayoquot Sound

  • Identify remaining intact rainforests, create a ‘solution space’

and develop proposals for new protected areas

  • Introduce new conservation measures across the landscape

such as restoration reserves (30% by landscape & ecosystem)

  • Ensure capacity for ongoing implementation, monitoring and

review of the 2016 Great Bear Rainforest Agreements

Vancouver island Great Bear Rainforest

slide-34
SLIDE 34
slide-35
SLIDE 35
slide-36
SLIDE 36