
SLIDE 1
1 Institute of Agricultural Engineering│Tropics and Subtropics Group
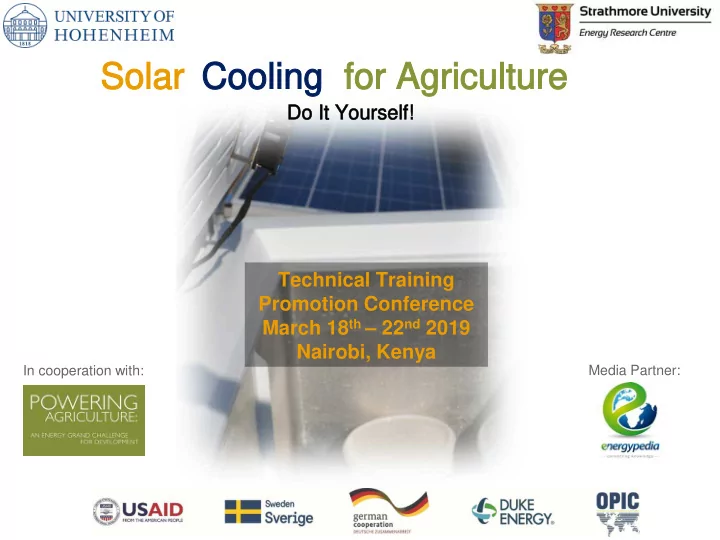
Solar Solar Cooling Cooling for Agriculture for Agriculture
Do It Yourself! Do It Yourself! Technical Training Promotion Conference March 18th – 22nd 2019 Nairobi, Kenya
In cooperation with: Media Partner: