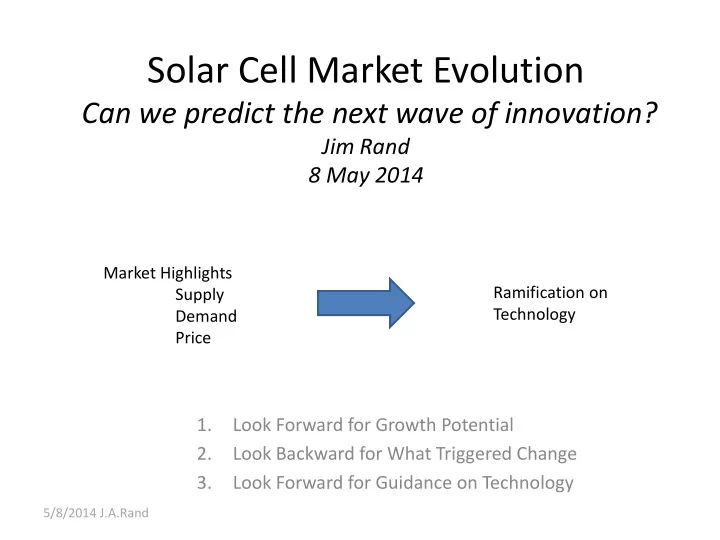

Solar Cell Market Evolution Can we predict the next wave of innovation? Jim Rand 8 May 2014 Market Highlights Ramification on Supply Technology Demand Price 1. Look Forward for Growth Potential 2. Look Backward for What Triggered Change 3. Look Forward for Guidance on Technology 5/8/2014 J.A.Rand
Definition: “The Market” = Flat Plate PV Conventional Silicon PV Modules Thin Film Convention, Rack Modules Mounted, One-Sun, (CdTe, CIGS) Flat-Plate Modules 5/8/2014 J.A.Rand 2
Definition: “The Market” = Flat Plate Silicon PV Capacity (MW) Market Share (%) 5/8/2014 J.A.Rand
1. Look Forward for Growth Potential $70 70 $60 60 The US has a great runway ahead with >100 GW Installed Module Capacity (GW) Average Selling Price (2011 $'s) to install, perhaps a good deal more $50 50 Existence Proof exists with Germany, which was $40 40 done at much higher price $30 30 $20 20 $10 10 $0 0 1976 1981 1986 1991 1996 2001 2006 2011 “Solar Industry Update”, David Feldman, Robert Margolis, NREL 5/8/2014 J.A.Rand 4
2. Look Backwards for Triggers to Change PV Module Experience Curve 40. Global Average Power -Module Price (2011$/Wp) 4. The first 25 Years The Missionary Period We knew we were doing the right thing – but there was no money in it. 0.4 0.1 1. 10. 100. 1,000. 10,000. 100,000. 1,000,000. 10,000,000. Cumulative PV Module Shipments (MWp) “Solar Industry Update”, David 5/8/2014 J.A.Rand Feldman, Robert Margolis, NREL 5
2001-2008 The Party Years 40. Global Average Power -Module Price (2011$/Wp) The Silicon Crisis with a Silver Lining 4. The Silver Lining of the Silicon Shortage 1. Profits!!!.....Wall Street notices, billions in investment follows 2. Productivity Increases are Accelerated…wafers get thinner quick 3. Technologist are Valued…..opportunity, respect, and stock options 4. More Room on the Field for Small P layers….the thin film window opens 0.4 0.1 1. 10. 100. 1,000. 10,000. 100,000. 1,000,000. 10,000,000. Cumulative PV Module Shipments (MWp) “Solar Industry Update”, David 5/8/2014 J.A.Rand Feldman, Robert Margolis, NREL 6
Huge Gains in Productivity Similar gains in all aspects of manufacturing (with the possible exception of labor) Compiled by David Feldman. Sources: 2004 CLSA. Solar Power: Sector Outlook. Michael Rogol. July 2005. 2005-2013 Photon Consulting. Solar Annual 2007, 2008, 2012, 2013. 5/8/2014 J.A.Rand
2009 to Today The End of the Beginning Profits disappear Manufacturing continues in places that don’t need profits 40. Global Average Power -Module Price (2011$/Wp) 4. By 2012, 77 different solar firms left the sector, either by closure, bankruptcy, or fire-sale. 0.4 “Rest in Peace: The List of Deceased Solar 0.1 1. 10. 100. 1,000. 10,000. 100,000. 1,000,000. 10,000,000. Companies”, Eric Wesoff, Greentech Media, 6 April Cumulative PV Module Shipments (MWp) 2013 5/8/2014 J.A.Rand 8
Recap of Present Status The Silicon Technology is Firmly in Place – Supply Chain – Manufacturability – Market Acceptance • Proven in the Field Prices are “dirt cheap” Investment Community Has Moved On Any new incremental technology improvement will be taken up by the existing manufacturers in Asia We are STILL not competitive without Incentives 5/8/2014 J.A.Rand
Addressing the Key Elements of $/kwh Reduce the Cost of the “Active” Make a cheaper module…only with Solar Cell Material and Device comparable efficiency Cost of the “Package” and reliability Enhance Productivity - 1400 Widespread use of Trackers? Just AZ? kwh/kw pv Decrease BOS We can all agree >30%....nothing Big Increase in Efficiency incremental 5/8/2014 J.A.Rand
High Efficiency at the Module Level SPWR Si 5/8/2014 J.A.Rand M.A. Green, “Third Generation Photovoltaics ”, 2003
Big Gains in Efficiency Come From: 1. Intermediate Bandgap 3 rd Generation 2. Thermal Photovoltaics 3. Hot Carrier Solar Cells Solar Cells 4. Multiple Electrons per Photon 5. Multi-Junction Solar Cells Only Multi-Junction Solar Cells have been shown to work. “CPV , mainly HCPV, is considered by some as a SpectroLab record efficiency sleeping giant. CPV is expected multi-junction device structure which has demonstrated 40.7% to reach around 1 GW of under concentration. production capacity by 2017” Global Market Outlook, 2013, EPIA 5/8/2014 J.A.Rand
End • My Next Venture: Performance and Reliability at • Jim.rand.solar@gmail.com the Module Level 5/8/2014 J.A.Rand
Recommend
More recommend