
SLIDE 1
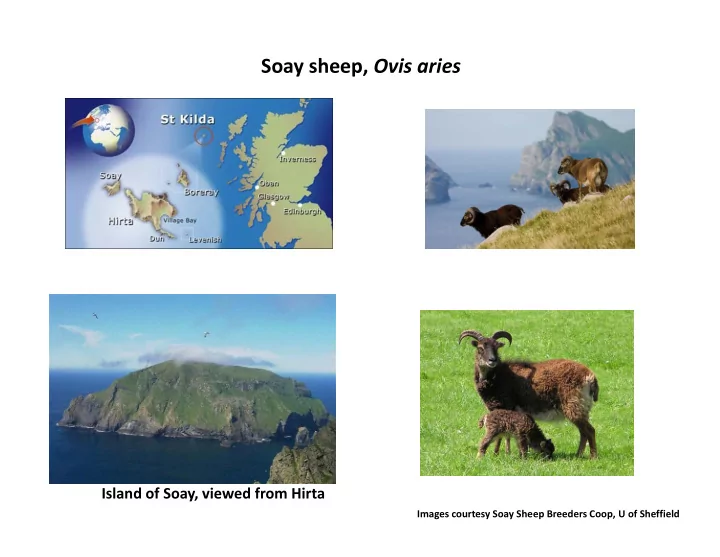
Soay sheep, Ovis aries
Island of Soay, viewed from Hirta
Images courtesy Soay Sheep Breeders Coop, U of Sheffield
Soay sheep, Ovis aries Island of Soay, viewed from Hirta Images - - PowerPoint PPT Presentation
Soay sheep, Ovis aries Island of Soay, viewed from Hirta Images courtesy Soay Sheep Breeders Coop, U of Sheffield Demographic projection matrices A demographic projection matrix is the (square) matrix formed by collecting the average transitions
Images courtesy Soay Sheep Breeders Coop, U of Sheffield
1 2 k
1 2 1 k
1 k
T
i j ij i i i
i
ij ij ij