
SLIDE 1
SMOOTHING AND ROUGHENING IN FAULTS
By Alexander Bissell
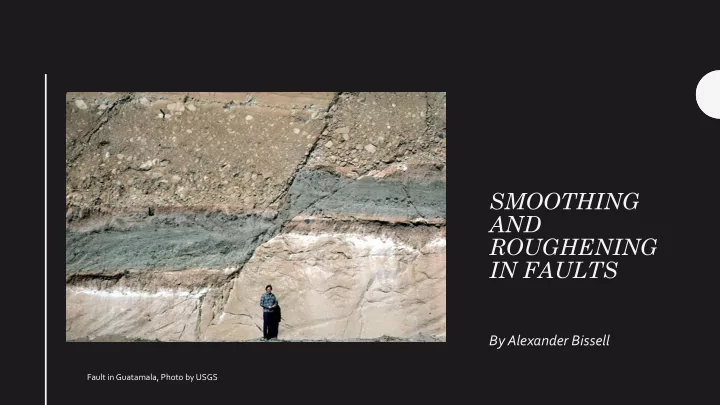
Fault in Guatamala, Photo by USGS
SMOOTHING AND ROUGHENING IN FAULTS By Alexander Bissell Fault in - - PowerPoint PPT Presentation
SMOOTHING AND ROUGHENING IN FAULTS By Alexander Bissell Fault in Guatamala, Photo by USGS The geometric properties of a fault zone have major effects on earthquake rupture STUDY processes OVERVIEW Characterizes a single, exposed
By Alexander Bissell
Fault in Guatamala, Photo by USGS
Coyote Canyon, So. Cal.
rich tonalite containing a weak regional foliation
A: Hydraulic Pump B: Computer to collect data C: Loading frame D: Loading frame control
younger, and in the slip-parallel direction
events
centimeter to 10 meter scale
roughening and smoothing regimes
layers acted to re-roughen by creating embayments
larger than grain size
smoothing event.
rougher than surrounding rock
– Fault outcrop mapped using photogrammetry – 150 photos taken of a highly exposed (56.5%) fault – External structure mapped using Structure from Motion technique – Internal structure measured in the field using standard stereo-net methods
a) Photograph of the fault. b)Computer generated 3D model c)Rectified texture of the fault after 3D generation. Blue = inner fault, green = outer fault
are taken from varying angles in a consistent light (i.e. an
cloud using the subtle shifts in shadows and edges from the movement of the camera
generate polygons, and a texture from the photos is applied
Model by Alexander Bissell using Agisoft PhotoScan
another, as well as against GPS data
added to increase accuracy
the phone, EXIF data from each photo is used to geo-rectify the
control points and reference markers were used.
slightly each time it is generated
more precise techniques ($$$)
– Use a Scanning Electron Microscope (SEM) to image on the grain scale – Do topological analysis to find out neat things (i.e. moment of inertia) – 3D print subsequent model for educational purposes – Impress your friends and colleagues with hand specimens of fly ash
(also seriously lets scan some microscopic stuff)