
SLIDE 1
Slides, graphs, tables, diagrams
- I. Types of graphic representation
- III. Lines and letters
- IV. Useful phrases
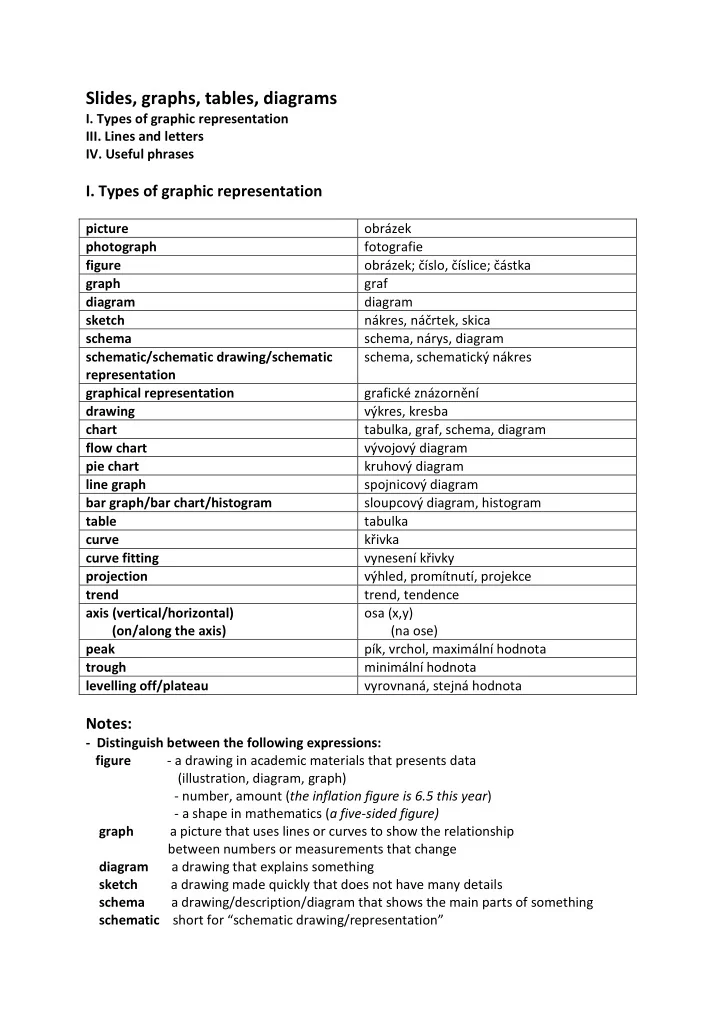
- I. Types of graphic representation
picture
- brázek
photograph fotografie figure
- brázek; číslo, číslice; částka
graph graf diagram diagram sketch nákres, náčrtek, skica schema schema, nárys, diagram schematic/schematic drawing/schematic representation schema, schematický nákres graphical representation grafické znázornění drawing výkres, kresba chart tabulka, graf, schema, diagram flow chart vývojový diagram pie chart kruhový diagram line graph spojnicový diagram bar graph/bar chart/histogram sloupcový diagram, histogram table tabulka curve křivka curve fitting vynesení křivky projection výhled, promítnutí, projekce trend trend, tendence axis (vertical/horizontal) (on/along the axis)
- sa (x,y)
(na ose) peak pík, vrchol, maximální hodnota trough minimální hodnota levelling off/plateau vyrovnaná, stejná hodnota
Notes:
- Distinguish between the following expressions:
figure - a drawing in academic materials that presents data (illustration, diagram, graph)
- number, amount (the inflation figure is 6.5 this year)
- a shape in mathematics (a five-sided figure)