
SLIDE 1
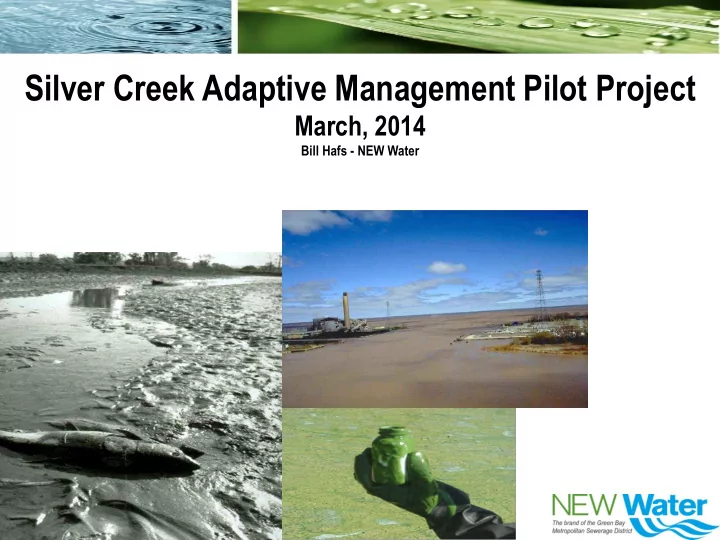
Silver Creek Adaptive Management Pilot Project
March, 2014
Bill Hafs - NEW Water
Silver Creek Adaptive Management Pilot Project March, 2014 Bill - - PowerPoint PPT Presentation
Silver Creek Adaptive Management Pilot Project March, 2014 Bill Hafs - NEW Water NEW Water 26,059 lbs Phosphorus (P) discharge per year. 8,710 lbs P reduction required by Total Maximum Daily Load (TMDL) Watershed Plan. $223 $394 million
Bill Hafs - NEW Water
NEW Water Wastewater Treatment Facility
Source Total Phosphorus (lbs./yr.) Natural Background 5,609 Agricultural 251,382 Urban ( non-regulatory) 15,960 Urban Regulated (MS4) 65,829 Construction Sites 7,296 General Permits 2,041 Industrial WWTFs 114,426 Municipal WWTFs * 87,160 Total In-Basin 549,703 Lake Winnebago 716,954 Total (In-Basin + Lake Winnebago 1,266,657 Source of tables: Total Maximum Daily Load and Watershed Management Plan for Total Phosphorus and Total Suspended Solids in the Lower Fox River Basin and Lower Green Bay (March 2012)
Out fall of NEW Water into Fox River September 2013
Estimated Costs Sources P TMDL Municipal WWTF’s: $400 – $500 million ?? 87,160 lbs/yr NEW Water: ($223 - $394 million) 26,059 lbs/yr
(capital costs 2010 and 2025) (included as part of total)
MS4’s storm water: $200 - $400 million ?? 65,829 lbs/yr
(2013 FWWA Conference)
Industrial WWTF’s: $200 million ?? 114,429 lbs/ yr Agriculture ??? 251,382 lbs/yr
Photo credit: Steve Seilo (www.photodynamix.com)
APRIL 15, 2011
Wet Pond at Commercial Site – DNR photo Grass swales Constructed wetlands Infiltration basins Pervious streets and lots Bio retention Infiltration Basin– DNR photo Concrete pavers in parking lot–
DNR photo
NEW Water Wastewater Treatment Facility
Nutrient Management Livestock density Sustainable Agriculture Buffer Strips Grassed Waterways Barnyard runoff control Sod cover – Winter Soil Phosphorus levels Conservation farm plans Rotational Grazing Cover Crops Wetland Restorations
Brown County photos
Reduced Cropland &
Brown County total land area is approximately 350,000 acres.
Source: 1991 Brown County Farmland Preservation Plan; USDA National Agricultural Statistical Service
Urban Sprawl
USDA National Agricultural Statistical Service
2010 – 2014: 67,650 acres
Source: Brown County
Cattle Cropland Acres/Cow Brown 105,000 162,000 1.54 Outagamie 85,000 194,700 2.29 Clark 136,500 235,800 1.73 Manitowoc 97,000 183,800 1.89 Calumet 60,000 120,900 2.02
Source NASS.
Source: Brown County
Source: Brown County
Silver Creek Watershed (LF05-8) a sub-watershed of the Lower Duck Creek (HUC12 040302040106
Watershed Area 4799.8 acres (7.50 mi2) MS4 346 acres (7.2% of watershed) Land cover 2012 Cropland Data Layer USDA NRCS Agricultural 2296.4 acres (47.8%) Forest 585.1 acres (12.2%) Grassland 12.3 acres (0.3%) Pasture 1065 acres (22.2%) Urban 503.9 acres (10.5%) Water 64.5 acres (1.3%) Wetlands 272.6 acres (5.7%) Stream Length 14.93 miles TMDL Phosphorus Baseline Load 3391 lbs. (0.71 lbs. per acre)
NEW Water Oneida Tribe USGS UW Green Bay USDA NRCS Agriculture & Private Agronomists US Fish & Wildlife Service Nature Conservancy Local Governments Ducks Unlimited
NEW Water Oneida Tribe USGS UW Green Bay USDA NRCS Agriculture & Private Agronomists US Fish & Wildlife Service Nature Conservancy Local Governments Ducks Unlimited
NEW Water Oneida Tribe USGS UW Green Bay USDA NRCS Agriculture & Private Agronomists US Fish & Wildlife Service Nature Conservancy Local Governments Ducks Unlimited
November 2013
Source: Brown County
Source: Brown County
Source: Brown County
Source: Brown County
Source: Brown County
Source: Brown County
Bill Hafs | Director of Environmental Programs Green Bay Metropolitan Sewerage District T: (920) 438-1040 E: hafs@newwater.us www.newwater.us