sharing some of the risk of the equity based cyclical
play

Sharing some of the risk of the equity-based cyclical sector - PDF document

Sharing some of the risk of the equity-based cyclical sector Introduction This 3 page paper illustrates one area in which risk sharing within a defined contribution pension scheme may help to secure lower volatility and protect the capital of


  1. Sharing some of the risk of the equity-based cyclical sector Introduction This 3 page paper illustrates one area in which risk sharing within a defined contribution pension scheme may help to secure lower volatility and protect the capital of members invested in an equity index fund. The strategy is designed to partly solve the problem of members’ dislike of investment volatility and loss, both of which contribute uncertainty around planning for retirement. The aim is to work through a concrete example of the way risk sharing might potentially be implemented that fits with pension scheme freedoms and pension transferability in the UK. The example used here is an equity-based cyclical sector risk sharing strategy. This example has been selected because the sharing of risk can take place over about 4 years and the whole of the pension fund’s asset allocation would be managed as usual. If the goal is a smoother investment outcome, the long-run historic volatility of the strategy lies between that of Gilts and that of equities. It is worth saying that this is just one type of arrangement that may be considered by schemes post 2015, being looked at here as a means of highlighting the sorts of factors scheme designers may want to take account of. NEST is currently carrying out a comprehensive consultation of the design of any future retirement solutions for its members and is looking to gather a range of views and insights.. Extra risk from investing in the cyclical sector A look at the main moving parts of an equity index reveals that some sectors are more cyclical than others. For example, retailing, information technology, industrials, materials, financials and energy tend to trend in one direction then the other more than telecommunications, utilities, healthcare and consumer staples. This trend gives the cyclical sector higher investment volatility, making it a more o
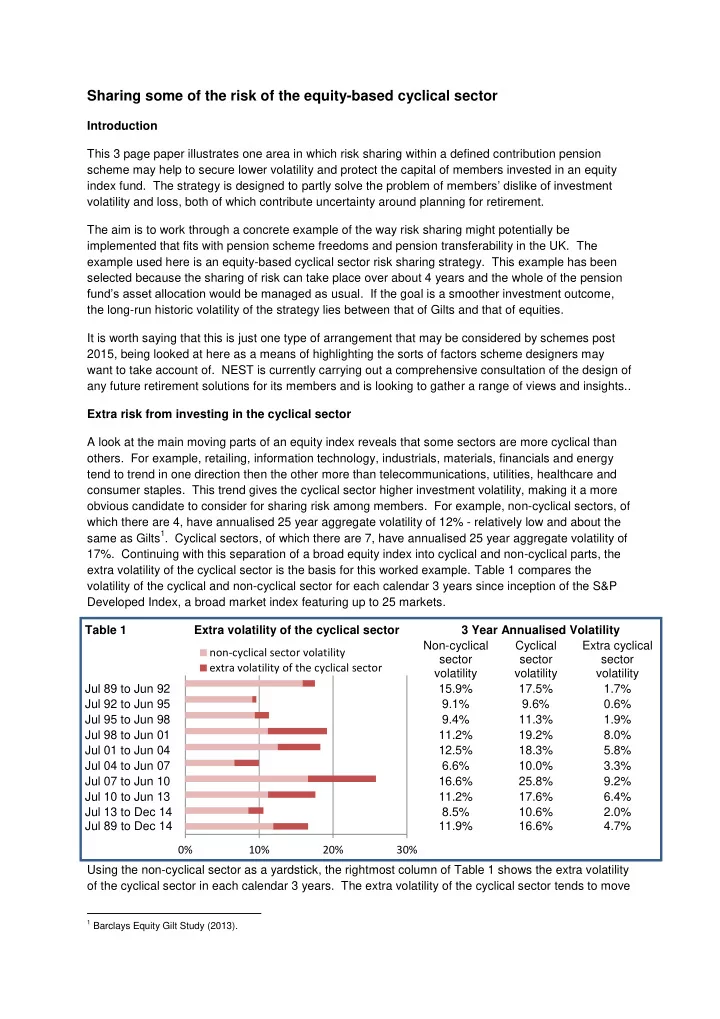
bvious candidate to consider for sharing risk among members. For example, non-cyclical sectors, of which there are 4, have annualised 25 year aggregate volatility of 12% - relatively low and about the same as Gilts 1 . Cyclical sectors, of which there are 7, have annualised 25 year aggregate volatility of 17%. Continuing with this separation of a broad equity index into cyclical and non-cyclical parts, the extra volatility of the cyclical sector is the basis for this worked example. Table 1 compares the volatility of the cyclical and non-cyclical sector for each calendar 3 years since inception of the S&P Developed Index, a broad market index featuring up to 25 markets. Table 1 Extra volatility of the cyclical sector 3 Year Annualised Volatility Non-cyclical Cyclical Extra cyclical non-cyclical sector volatility sector sector sector extra volatility of the cyclical sector volatility volatility volatility Jul 89 to Jun 92 15.9% 17.5% 1.7% Jul 92 to Jun 95 9.1% 9.6% 0.6% Jul 95 to Jun 98 9.4% 11.3% 1.9% Jul 98 to Jun 01 11.2% 19.2% 8.0% Jul 01 to Jun 04 12.5% 18.3% 5.8% Jul 04 to Jun 07 6.6% 10.0% 3.3% Jul 07 to Jun 10 16.6% 25.8% 9.2% Jul 10 to Jun 13 11.2% 17.6% 6.4% Jul 13 to Dec 14 8.5% 10.6% 2.0% Jul 89 to Dec 14 11.9% 16.6% 4.7% 0% 10% 20% 30% Using the non-cyclical sector as a yardstick, the rightmost column of Table 1 shows the extra volatility of the cyclical sector in each calendar 3 years. The extra volatility of the cyclical sector tends to move 1 Barclays Equity Gilt Study (2013).

  2. from higher periods lasting 3 to 4 years to lower periods also lasting 3 to 4 years. This has to do with the link between the cyclical sector and economic cycle. This behaviour makes sharing risk among savers manageable over a 4 to 5 year period. Chart 1 presents the 3 to 4 year repeating pattern of extra volatility. This matters because the aim here is to flatten the amplitude through risk sharing. Chart 1 Cyclical sector volatility minus non-cyclical sector volatility: 3 year 11% rolling 9% Extra 7% volati 5% lity of cyclic 3% al secto 1% r -1% Jan-92 Nov-92 Sep-93 Jul-94 May-95 Mar-96 Jan-97 Nov-97 Sep-98 Jul-99 May-00 Mar-01 Jan-02 Nov-02 Sep-03 Jul-04 May-05 Mar-06 Jan-07 Nov-07 Sep-08 Jul-09 May-10 Mar-11 Jan-12 Nov-12 Sep-13 Jul-14 Summarising Table 1 and Chart 1 together, the cyclical sector has extra volatility, and this breaks down to being a little bit higher for 3 to 4 years followed by being quite a bit higher for 3 to 4 years. No extra return from investing in the cyclical sector If investors were rewarded for taking this extra risk then the argument for sharing risk would have little foundation – members would earn a return commensurate with the risk taken. However, the extra volatility of the cyclical sector over the economic cycle has earned investors no extra return. Using the returns of the non-cyclical sector as a yardstick, Table 2 presents the extra returns from the cyclical sector for each calendar 3 years since inception of the S&P Developed Index. The extra volatility taken is also shown. Table 2 Extra return of the cyclical sector 3 Year Annualised Returns Cyclical Extra extra volatility of cyclical to non-cyclical sector Non-cyclical sector cyclical extra return of cyclical to non-cyclical sector sector return return sector return Jul 89 to Jun 92 10.6% 0.4% -10.2% Jul 92 to Jun 95 7.6% 11.0% 3.4% Jul 95 to Jun 98 10.9% 11.6% 0.8% Jul 98 to Jun 01 0.9% 3.2% 2.2% Jul 01 to Jun 04 -0.3% 3.8% 4.1% Jul 04 to Jun 07 14.5% 17.8% 3.3% Jul 07 to Jun 10 -8.6% -12.0% -3.5% Jul 10 to Jun 13 11.0% 12.4% 1.4% Jul 13 to Dec 14 7.1% 5.7% -1.4% Jul 89 to Dec 14 7.6% 6.7% -0.9% -10% -5% 0% 5% 10% The rightmost column of Table 2 reveals the extra return from holding the cyclical sector. The sum of this column is virtually zero, indicating no extra return is earned for the extra risk taken. The correlation of the extra return in each 3 year period with the extra risk taken in each 3 year period (taken from the rightmost column of Table 1) is 0.1, which is low, and tells us there’s no relationship between taking the extra risk and any extra return.

  3. While the focus of this paper is investing in an equity index, it’s worth noting that some DC schemes may use active fund managers who can successfully rotate in and out of the cyclical sector with timing and selection skill that provide extra return. There is no rotation in and out of the cyclical sector for investors in an equity index fund, and no extra return has been earned for holding the cyclical sector over the 25 year period. The volatility and return experienced by an index investor from holding the cyclical sector will depend on when he or she starts and stops investing and whether these periods coincide higher or lower sector return and volatility. To summarise, investors in an equity index fund have experienced extra risk when holding the cyclical sector risk over the economic cycle. The extra volatility has not been rewarded. The investment experience of members has partly depended on the sequencing of their investment – or start and stop dates. The investment experience has depended more on the sequencing of the cyclical sector than the non-cyclical sector. Sharing the extra risk of the cyclical sector What are the options for trustees who want to reduce some investment volatility for members? They could offload the extra risk of the cyclical sector through divestment but this would reduce diversification and not be financially efficient. They could move to a series of actively managed mandates focused on different equity styles but this may mean a DC scheme undertaking a major redesign of mandates with no promise of success. An alternative avenue is to share the extra risk of the cyclical sector among members. Inter-temporal risk sharing with other investors may help to partly offload the extra risk. Implementing risk sharing in practice might involve separating a broad equity index into 2 sector- based sub parts. Sub part one is the unit-linked actual market return of the non-cyclical sector. Sub part two is the unit-linked smoothed return of the cyclical sector. The computation for the smoothed return would be long enough to reach across the higher and lower extra volatility of the cyclical sector and so smooth it. This might look like a 4 year unitised, smoothed, moving average return as illustrated in Chart 2 below. A s it’s the extra we’re interested in, a rolling 4 year average return is superimposed on the 1 year to illustrate the smoothed extra return. A 4 year smoothed extra return from the cyclical sector would have significantly flattened the extra volatility experienced when investing in the cyclical sector. Investors receive the non-cyclical sector return and the smoothed cyclical sector extra return, which may be an increment more or less than the non-cyclical sector return. The smoothed return would be unit-linked and daily priced. The overall daily index fund performance would comprise the weighted sum of the two sub funds, one cyclical, one non-cyclical. 40% Chart 2 Annual cyclical sector return minus annual non-cyclical sector return and Cyclical sector return difference its 4 year moving average 30% 20% 10% 0% -10% -20% 48 month moving average return difference -30% Jun-90 May-91 Apr-92 Mar-93 Feb-94 Jan-95 Dec-95 Nov-96 Oct-97 Sep-98 Aug-99 Jul-00 Jun-01 May-02 Apr-03 Mar-04 Feb-05 Jan-06 Dec-06 Nov-07 Oct-08 Sep-09 Aug-10 Jul-11 Jun-12 May-13 Apr-14

Download Presentation
Download Policy: The content available on the website is offered to you 'AS IS' for your personal information and use only. It cannot be commercialized, licensed, or distributed on other websites without prior consent from the author. To download a presentation, simply click this link. If you encounter any difficulties during the download process, it's possible that the publisher has removed the file from their server.

Recommend


More recommend