
http://www.responsiblelending.org
Auto Lending Abuses: The Pitfalls of Financing Cars
Presentation of Chris Kukla NC State Bar Legal Assistance for Military Personnel Meeting October 14, 2011
http://www.responsiblelending.org 2
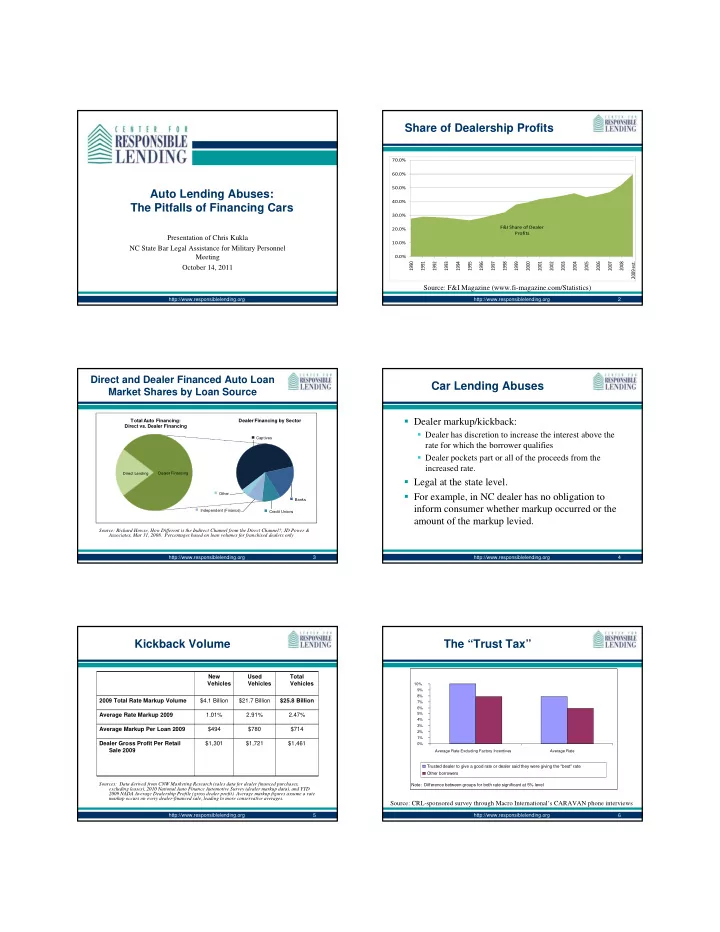
Share of Dealership Profits
Source: F&I Magazine (www.fi-magazine.com/Statistics)
F&I Share of Dealer Profits 0.0% 10.0% 20.0% 30.0% 40.0% 50.0% 60.0% 70.0% 1990 1991 1992 1993 1994 1995 1996 1997 1998 1999 2000 2001 2002 2003 2004 2005 2006 2007 2008 2009 est. http://www.responsiblelending.org 3
Direct and Dealer Financed Auto Loan Market Shares by Loan Source
Source: Richard Howse, How Different is the Indirect Channel from the Direct Channel?, JD Power & Associates, Mar 31, 2008. Percentages based on loan volumes for franchised dealers only
Direct Lending Captives Banks Credit Unions Independent (Finance) Other Dealer FinancingTotal Auto Financing: Direct vs. Dealer Financing Dealer Financing by Sector http://www.responsiblelending.org 4
Car Lending Abuses
Dealer markup/kickback:
Dealer has discretion to increase the interest above the rate for which the borrower qualifies Dealer pockets part or all of the proceeds from the increased rate.
Legal at the state level. For example, in NC dealer has no obligation to inform consumer whether markup occurred or the amount of the markup levied.
http://www.responsiblelending.org 5
Kickback Volume
New Vehicles Used Vehicles Total Vehicles 2009 Total Rate Markup Volume $4.1 Billion $21.7 Billion $25.8 Billion Average Rate Markup 2009 1.01% 2.91% 2.47% Average Markup Per Loan 2009 $494 $780 $714 Dealer Gross Profit Per Retail Sale 2009 $1,301 $1,721 $1,461
Sources: Data derived from CNW Marketing Research (sales data for dealer financed purchases, excluding leases), 2010 National Auto Finance Automotive Survey (dealer markup data), and YTD 2009 NADA Average Dealership Profile (gross dealer profit). Average markup figures assume a rate markup occurs on every dealer-financed sale, leading to more conservative averages. http://www.responsiblelending.org 6
The “Trust Tax”
0% 1% 2% 3% 4% 5% 6% 7% 8% 9% 10% Average Rate Excluding Factory Incentives Average Rate Trusted dealer to give a good rate or dealer said they were giving the "best" rate Other borrowers Note: Difference between groups for both rate significant at 5% level.Source: CRL-sponsored survey through Macro International’s CARAVAN phone interviews