Shake Table Experiment on Circular Reinforced Concrete Bridge Column - - PDF document

shake table experiment on circular reinforced concrete
SMART_READER_LITE
LIVE PREVIEW

Shake Table Experiment on Circular Reinforced Concrete Bridge Column - - PDF document

Shake Table Experiment on Circular Reinforced Concrete Bridge Column under Multidirectional Seismic Excitation Junichi Sakai & Shigeki Unjoh Public Works Research Institute 2007 STRUCTURES CONGRESS May 17th, 2007, Long Beach, USA Shake


slide-1
SLIDE 1

Shake Table Experiment on Circular Reinforced Concrete Bridge Column under Multidirectional Seismic Excitation Junichi Sakai & Shigeki Unjoh

May 17th, 2007, Long Beach, USA 2007 STRUCTURES CONGRESS

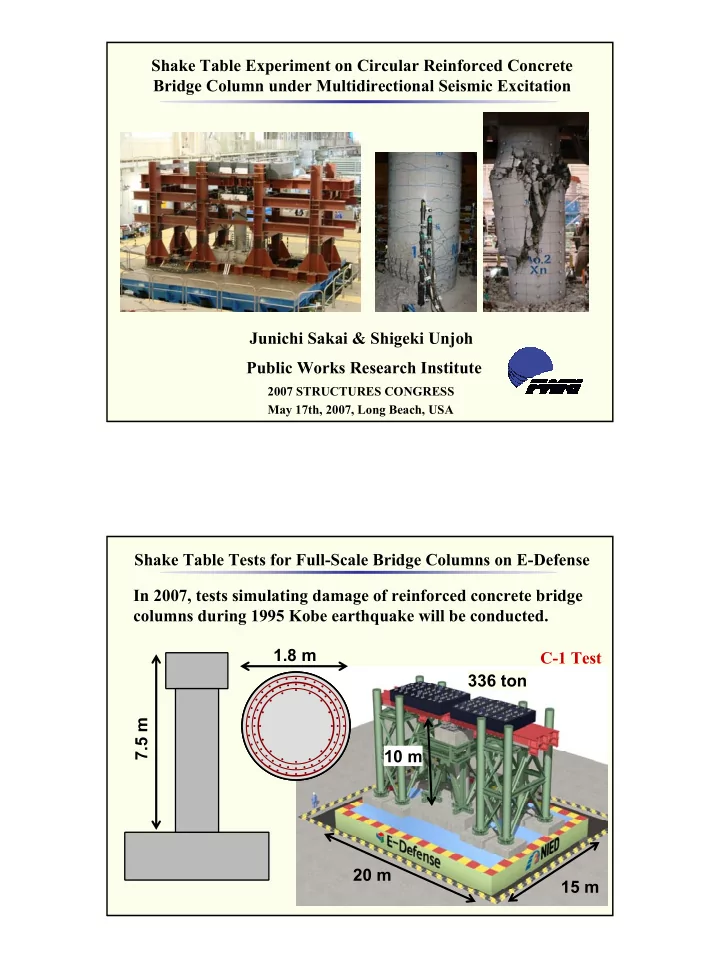
Public Works Research Institute Shake Table Tests for Full-Scale Bridge Columns on E-Defense 7.5 m 1.8 m 336 ton 20 m 15 m 10 m

軸方向鉄筋 SD295 D29-32本×2.5段 横拘束筋 SD295 外: D13@150 中: D13@300 内: D13@300 軸方向鉄筋 SD295 D29-32本×2.5段 横拘束筋 SD295 外: D13@150 中: D13@300 内: D13@300

In 2007, tests simulating damage of reinforced concrete bridge columns during 1995 Kobe earthquake will be conducted. C-1 Test

slide-2
SLIDE 2

Full-Scale and Small-scaled Bridge Models PWRI E-Defense 2.5 m 7.5 m 38 ton 336 ton 20 m 15 m 8 m 8 m Loading Capacity: 300 tf Loading Capacity: 1200 tf Shake table tests

  • f Small-scaled models

have been conducted

  • n PWRI shake table.

Purpose of Shake Table Tests for Small-Scaled Models To investigate dynamic behavior and failure mode of reinforced concrete bridge column under multidirectional loading To provide test data to investigate the specimen size effects by comparison of results between small and full size specimens To provide data to calibrate analytical models to simulate C-1 model tests on E-Defense To check how the test setup of E-Defense test works Bearings, Instrumentation

  • 1. Test for cantilever type specimen (in January 2006)
  • 2. Test using similar setup of C-1 tests (in December 2006)
  • a. Column that fails in flexure at bottom of column
  • b. Column that fails in shear at cut-off point of longitudinal bars
slide-3
SLIDE 3

600 mm (23.6 in.) Longitudinal: 40@D10 (No. 3) = 1.01% = 351 MPa Hoops: D6 (No.2)@75 mm = 0.31% = 340 MPa 1/4 Scaled Model ρ

l

ρ

s

f

sy

f

sy

f = 41.6 MPa

co

Natural Period: 0.3 sec (X, Y) 0.08 sec (Z) Shake Table Tests for Cantilever-Type Specimen 3 m C.G. 0.6 m Input Ground Motion

10

  • 10

Acceleration (m/sec2)

1983 Nihonkai Chubu, Japan, earthquake

One of Design Ground Motions of JRA (Type I, G.C.-III) 10

  • 10

10 20 30 40 50

  • 10

5 Time (sec) X (LG): PGA= 11.1 m/sec2 (2.8 m/sec2) Y (TR): PGA= 9.5 m/sec2 (2.4 m/sec2) Z (UD): PGA= 8.2 m/sec2 (2.1 m/sec2) Amplitude = 400% Time = 50%

slide-4
SLIDE 4

400% of Tsugaru Bridge Global Response of Cantilever-Type Specimen Response Ductility = 12~13 Yp Yn Xp Xn Z (Movie) 400% of Tsugaru Bridge Local Response of Cantilever-Type Specimen Local Response (Xn Face)

Yp Yn

(Movie)

slide-5
SLIDE 5

Response Displacement and Damage Progress

  • 0.2

0.2

  • 0.1

0.1

du

  • 0.20

10 20 30

Displacement (m) Time (sec) 1 2 3 1 2 3 X direction

du

  • 0.2

0.2

  • 0.2

0.2

  • Disp. in Y (m)
  • Disp. in X (m)

Orbit

1 2 3

du Calibration of Analytical Model Fiber Element

0.005 0.01 20 40 60 Strain Damping Ratio

Concrete Model Mander Hoshikuma (JRA)

Cover 0.05 0.1 10 20 30 40 50

Damping Assumption Rayleigh Damping ξ = 2% ξ = 0.1%

(Hz) Stress (MPa) Buckling, Fracture are not considered.

slide-6
SLIDE 6

Accuracy of Analysis -Effect of Damping- 400% of Tsugaru Bridge

Hoshikuma et al. (1997) 0.2

  • 0.2

Rayleigh Damping ξ = 2% ξ = 0.1%

Displacement (m) 5 10 15 20 0.2

  • 0.2

Rebar Buckling Test

Time (sec)

Rebar Fracture

X direction Y direction 5 10 15 20 0.2

  • 0.2

0.2

  • 0.2

Accuracy of Analysis -Effect of Concrete Model- 400% of Tsugaru Bridge ξ = 0.1%

Displacement (m)

Rebar Fracture Rebar Buckling Test Concrete Models Hoshikuma Mander

Time (sec) X direction Y direction

slide-7
SLIDE 7

Test for Small-Scaled Models Using Similar Setup of C-1 Tests

  • 1. Test for cantilever type specimen (in January 2006)
  • 2. Test using similar setup of C-1 tests (in December 2006)
  • a. Column that fails in flexure at bottom of column
  • b. Column that fails in shear at cut-off point of longitudinal bars

PWRI E-Defense 2.5 m 7.5 m 38 ton 336 ton 20 m 15 m 8 m 8 m 1/3 Scaled Model

橋脚模型 端部支点 端部支点 橋脚模型 端部支点 端部支点

Details of Boundary Conditions

Inertia Force in LG: Only Specimen Carries Inertia Force in TR: Specimen and End Supports Carry Axial Force: Depends on Locations of Weights MOVE FIX FIX : FIX for LG & TR; FREE for Rotation : FIX for TR; FREE for LG & Rotation : Slide Bearing SPECIMEN END-SUPPORT END-SUPPORT

Safety Consideration 3 Dimensional Earthquake Excitation

slide-8
SLIDE 8

Hoops D3

Shear Failure Model

Hoops D3

Specimens

Longitudinal D10

2 m

O: 50 M: 100 I : 100 O: 50 M: 100 I : 100 80 bars O: 100 M: 100 I : 100 80 bars 100 bars 40 bars Longitudinal D10 O: 50 M: 100 I : 100 O: 50 O: 100 M: 100 O: 100 O: 100 M: 100 I : 100 O: Outside M: Middle I : Inside

Flexural Failure Model

Cut-Off Cut-Off

Global Response of Flexural Failure Model 80% of JR Takatori (Movie)

slide-9
SLIDE 9

Damage Progress of Flexural Failure Model 80% of JR Takatori (Movie)

2.6 sec 3.6 sec 3.1 sec 4.4 sec

  • 0.2

0.2

  • 0.2

0.2

Response Displacement of Flexural Failure Model

80% of JR Takatori 3.6 sec 3.1 sec 4.4 sec

  • 0.2

0.2 2 4 6 8 10

  • 0.1

0.1 Displacement (m)

LG TR

Disp in TR (m) Disp in LG (m)

slide-10
SLIDE 10

Global Response of Shear Failure Model 80% of JR Takatori (Movie) Damage Progress of Shear Failure Model 80% of JR Takatori (Movie)

2.9 sec 3.0 sec 3.1 sec 3.7 sec 4.4 sec

slide-11
SLIDE 11

Response Displacement of Shear Failure Model

80% of JR Takatori 2.9 sec 3.0 sec 3.1 sec 3.7 sec 4.4 sec Displacement (m)

LG TR

  • 0.2

0.2 2 4 6 8 10

  • 0.1

0.1 At 3 sec, specimen hit the supporting frame. At 4.4 sec, specimen is totally supported by the frame due to shear failure.

  • Dynamic behavior and damage progress of reinforced

concrete columns under multidirectional earthquake excitation are investigated through shake table tests.

  • Failure mechanisms of bridge columns that damaged during

1995 Kobe earthquake are simulated on shake table.

  • Analytical models are calibrated using the test results.

Conclusions Analytical simulation of shake table tests of full-scale bridge model on E-Defense is being conducted.

slide-12
SLIDE 12

APPENDICES

Shake Tables

± 0.6 (0.3) m ±1 (0.5) m

  • Max. Displacement

2 (1) m/sec 2 (0.7) m/sec

  • Max. Velocity

20 (10) m/sec2 9 (15) m/sec2

  • Max. Acceleration

300 tf 1200 tf

Loading Capacity

8 m × 8 m 20 m × 15 m

Table Size

PWRI E-Defense

( ): Capacity for Vertical Direction

slide-13
SLIDE 13

Scaling Factors 27 S3 Moment (ML2T-2) 3 S Stiffness (MT-2) 9 S2 Force (MLT-2) 1 1 Strain (1) 1 1 Elastic Modulus (ML-1T-2) 3 S Displacement (L) 1.73 S Velocity ( LT-1 ) 1 1 Acceleration (LT-2) 9 S2 Mass (M) 1.73 S Time (T) 3 S Length (L) Target Scaling Factor Diameter of Column E-Defense: 1.8 m; PWRI: 0.6 m