SLIDE 1
BudgetMap:
Engaging Taxpayers in the Issue-Driven Classification of a Government Budget
SLIDE 2 Nam Wook Kim Harvard Jonghyuk Jung KAIST Eun-Young Ko KAIST Songyi Han KAIST Changwon Lee KAIST Juho Kim Stanford & KAIST Jihee Kim KAIST
BudgetMap:
Engaging Taxpayers in the Issue-Driven Classification of a Government Budget
SLIDE 3
Sewol Ferry Disaster Apr 16, 2014, 294 out of 476 people died
SLIDE 4
325 of the passengers were secondary school students on a field trip.
SLIDE 5
Citizens became suspicious about where the government spends their taxes.
Public safety
SLIDE 6 Difficult to explore government programs for a particular issue
Source: US Office of Management and Budget, 2016
SLIDE 7 Source: US Office of Management and Budget, 2016
Programs related to the issue are spread out across various budget categories
SLIDE 8
“The traditional budget classification system is mainly designed for administrative efficiency.” — A former congressman
SLIDE 9
Simply opening up more budget information to the public may not be sufficient.
Open Government
SLIDE 10
Supporting the navigation of a government budget through social issues
SLIDE 11 A social problem or conflict raised by a society.
Supporting the navigation of a government budget through social issues
from Wikipedia
SLIDE 12 Supporting the navigation of a government budget through social issues
- Use the language of the public
- Reflect timely public interests
SLIDE 13
Challenge
How can we classify budget
data using social issues?
SLIDE 14 Challenge
How can we classify budget data using social Issues?
- Huge amount of budget data
- Constantly changing social issues
SLIDE 15 Challenge
How can we classify budget data using social Issues?
- Huge amount of budget data
- Constantly changing social issues
Unsustainable for a government to handle this problem every time a new issue arises.
SLIDE 16 Challenge
How can we classify budget data using social Issues?
- Huge amount of budget data
- Constantly changing social issues
Automated solution may not be able to understand nuances in social issues.
SLIDE 17
Citizensourcing + Tagging
To turn to taxpayers to classify budget programs with social issues.
SLIDE 18
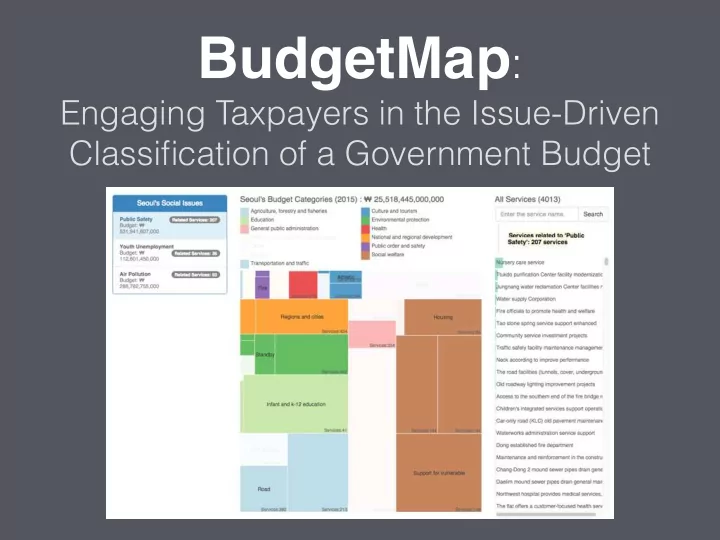
BudgetMap
Solicits taxpayers to identify issue-budget tags and facilitates visual exploration of the tagged budget data
SLIDE 19
Budget Data from the City of Seoul
Budget spending and Budget categories for 4013 programs in 2015
SLIDE 20 Budget Data Model
Program is
a unit of operating budget for a set of services.
SLIDE 21 Social Issue
is a form of tag that may connect to multiple programs.
Budget Data Model
SLIDE 22 Social
Issue
Budget
Program
N-to-N relationship
Budget Data Model
SLIDE 23 “Related”
Social
Issue
Budget
Program “Unrelated” “Unclear”
N-to-N relationship
Tag Types
Budget Data Model
SLIDE 24 BudgetMap Tagging Interface
Implementation
SLIDE 25 BudgetMap Tagging Interface
and the list goes on
Explore randomly selected budget programs
Implementation
SLIDE 26 Majority Voting
Public Safety Special Rescue Team Operation Issue Program
Implementation
SLIDE 27 Majority Voting
Public Safety Special Rescue Team Operation Related if
10 people
‘Related’ Tags
>
‘Unrelated’ Tags
5 people
Threshold (x)
+
Issue Program
Implementation
e.g.,x=3
SLIDE 28 BudgetMap Visualization
Automatically Translated Implementation
SLIDE 29 BudgetMap Visualization
Social Issues
Implementation
SLIDE 30 BudgetMap Visualization
Budget Categories
Implementation
SLIDE 31 BudgetMap Visualization
Budget Programs for the current category
Implementation
SLIDE 32 BudgetMap Visualization
Selected Issue: Air Pollution
Implementation
SLIDE 33 BudgetMap Visualization
Budget programs related to Air Pollution
Implementation
SLIDE 34 BudgetMap Visualization
Span multiple budget categories
Implementation
Transportation Health Environment …
SLIDE 35
Evaluation
Tagging results and perception changes after tagging tasks
SLIDE 36 Evaluation: Procedure
Pre-task Survey Tagging Task Post-task Survey
SLIDE 37 Pre-task Survey Tagging Task Post-task Survey
+ Interviews with budget experts
Evaluation: Procedure
SLIDE 38 Pre-task Survey Tagging Task Post-task Survey
+ Interviews with budget experts
Evaluation: Procedure
Paid for participation
SLIDE 39 Pre-task Survey Tagging Task Post-task Survey Informedness & perspective on the city’s budget.
Evaluation: Procedure
SLIDE 40 Pre-task Survey Tagging Task Post-task Survey Changes in informedness & perspective
Evaluation: Procedure
SLIDE 41 Pre-task Survey Tagging Task Post-task Survey Tagging budget programs with: 1) public safety, 2) air pollution, and 3) youth unemployment.
Evaluation: Procedure
SLIDE 42 104 citizens participated through
- nline communities & social media,
generated 730 tags per participant.
Evaluation: Tag Results
SLIDE 43 104 citizens participated through
- nline communities & social media,
generated 730 tags per participant. Compared with a reference solution constructed by 3 budget experts
Evaluation: Tag Results
SLIDE 44 Evaluated by varying the threshold (x) in the majority voting formula:
’Related’ Tags > ‘Unrelated’ Tags + threshold (x)
Evaluation: Tag Results
threshold(x) accuracy(%)
SLIDE 45 84% (x=3) of the issue-budget tags were correctly matched to the reference solution.
Evaluation: Tag Results
SLIDE 46 Coverage of Participants’ Tags
Public Safety: 7% (843 tags) Air Pollution: 14% (1685 tags) Youth Unemployment: 33% (3973 tags)
threshold(x=3)
Evaluation: Tag Results
Out of Total Possible Tags 3 issues x 4,013 programs = 12,039 tags
SLIDE 47 People are capable of contributing expert-quality tags
Evaluation: Summary
SLIDE 48 Participants’ level of informedness significantly improved after tagging tasks
“I know in which budget programs Seoul’s tax revenues are spent.”
Evaluation: Survey Results
SLIDE 49 Their perspective on government spending marginally improved, remaining on the negative side.
“The city government is executing its budget in the right direction regarding public safety.”
Evaluation: Survey Results
SLIDE 50 People gain informational benefits from doing tagging tasks.
Evaluation: Summary
SLIDE 51
Lessons
SLIDE 52
Confirmed the Feasibility of Issue-Driven Approach
SLIDE 53
“We encounter social issues in our daily lives. They made it easier for me to evaluate the suitability of budget programs.” — p045
SLIDE 54
“Understanding government budget spending through issues would be effective in solving social problems.” — p026
SLIDE 55
“The issue-driven approach would be more intuitive to the general public.” — Officer in the Seoul government
SLIDE 56
More importantly,
By looking into the differences among tags
SLIDE 57
No ground truth for issue-program tags
SLIDE 58
Individuals have different perspectives
SLIDE 59 Dealing with
calls for a different kind of quality control.
SLIDE 60
Important to incorporate diverse, contextual, and localized viewpoints
SLIDE 61
Limitations & Future Work
Allow people to create new issues & Live deployment & Data spanning multiple years
SLIDE 62 BudgetMap is
a step toward
participatory democracy
Improve awareness
Build systems for
civic engagement Leverage open government data
SLIDE 63
Make Government Great Again!
SLIDE 64
budgetwiser.org
Thank you
namwkim@seas.harvard.edu