SLIDE 17 11
Estimates of Carbon Price
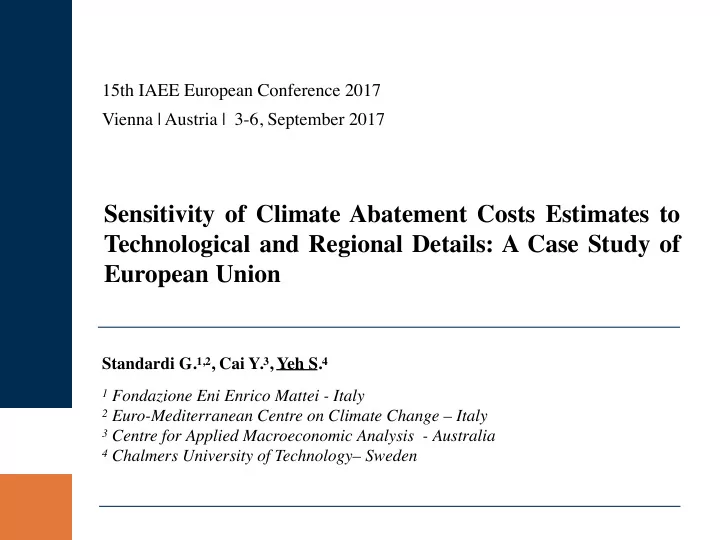
$ per ton of Co2 $ per ton of CO2 Effect of regional disaggregation Effect of tech disaggregation Effect of both CTAP-EU1 361.54 CTEM-EU1 191.26
CTAP-EU3 340.46
CTEM-EU3 185.51
CTAP-EU27 306.48
CTEM-EU27 173.99
- 6%
- 43%
- 49%
- The directions of results are consistent with the Italian sub-national modeling
exercise (Standardi et al., 2017).
- Comparing the most and the least aggregated models (CTAP-EU1 and CTEM-
EU27), estimated C price is around 50% smaller using the model with the most detailed spatial and technological details.
- But, in the EU experiment the technological details appear to be far more important
than the geographical details in affecting the estimates of carbon prices and GDP losses.
- The impacts of regional disaggregation diminish as more regions or more technological
details (shaded red in the previous slide) are added.