Seniors Plans to Teach at Some Point in Career, 2009 American - - PowerPoint PPT Presentation

seniors plans to teach at some point in career 2009
SMART_READER_LITE
LIVE PREVIEW

Seniors Plans to Teach at Some Point in Career, 2009 American - - PowerPoint PPT Presentation

Seniors Plans to Teach at Some Point in Career, 2009 American Dental Education Association Yes No Unsure 50% 45% 44% 40% 35% 38% 30% 25% 20% 18% 15% 10% 5% 0% Plans to Teach Source: American Dental Education Association ,


slide-1
SLIDE 1

American Dental Education Association

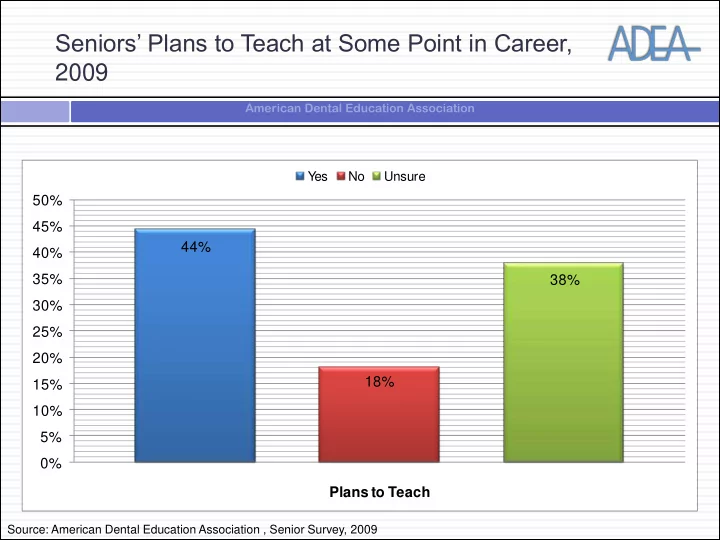
Seniors’ Plans to Teach at Some Point in Career, 2009

44% 18% 38% 0% 5% 10% 15% 20% 25% 30% 35% 40% 45% 50% Plans to Teach

Yes No Unsure

Source: American Dental Education Association , Senior Survey, 2009

slide-2
SLIDE 2

American Dental Education Association

Seniors’ Perceptions of Degree to Which Educational Debt is a Factor Influencing Immediate Plans, 2009

30% 8% 0.2% 49% 13% 42% 10% 1% 37% 10% 0.3% 0.4% 1% 25% 12% 64% 15% 0.2% 11% 9% 69% 14% 0.1% 8% 8%

0% 10% 20% 30% 40% 50% 60% 70% 80% Private Practice Government Service Teaching/Research Advanced Education Undecided Immediate Plan

Not at all Somewhat Moderately Much Very much

Source: American Dental Education Association , Senior Survey, 2009

slide-3
SLIDE 3

American Dental Education Association

Immediate Practice Plans of U.S. Dental School Graduates, 1980 – 2008 (of those entering private practice upon graduation)

0% 10% 20% 30% 40% 50% 60% 1980 1985 1990 1995 1996 1997 1998 1999 2000 2001 2002 2003 2004 2005 2006 2007 2008 Percent of Graduates Year

Solo Practice Partner-Group Employed Total Entering Private Practice

Source: American Dental Education Association, 2009 Senior Survey

slide-4
SLIDE 4

American Dental Education Association

Distribution of Professionally Active Dentists by Scope of Practice, 2006

Source: American Dental Association, 2006

slide-5
SLIDE 5

American Dental Education Association

Gender Distribution Among Professionally Active Dentists, 2006

80.3% 19.7%

Male Female 0% 20% 40% 60% 80% 100%

All Graduates

Male Female 64.1% 35.9%

Male Female 0% 20% 40% 60% 80% 100%

Dentists Graduating from 1997-Present

Male Female

Source: American Dental Association, 2006

slide-6
SLIDE 6

American Dental Education Association

Distribution of Specialists, 2006

Source: American Dental Association, 2006

slide-7
SLIDE 7

American Dental Education Association

Age Distribution of Professionally Active Dentists, 2006

Source: American Dental Association, 2006

slide-8
SLIDE 8

American Dental Education Association

Distribution of Race Among Professionally Active Dentists, 2006

Source: American Dental Association, 2006

slide-9
SLIDE 9

American Dental Education Association

Number of Professionally Active Dentists per 100,000 U.S. Population, 1976 – 2020 (projected)

The American Dental Association estimates that the national supply of dental services will increase due to a significant increase in dental productivity

Dental productivity is expected to increase through increased employment of allied dental professionals

Source: American Dental Association, Survey Center, Dental Workforce Model 2001-2025, http://www.ada.org/ada/prod/survey/publications_workforce.asp#historicalreport

slide-10
SLIDE 10

American Dental Education Association

Employment Status of All U.S. Dentists in Private Practice, 2007

Source: American Dental Association, 2007 Survey of Dental Practice

90.6% of professionally active dentists are in private practice

slide-11
SLIDE 11

American Dental Education Association

Average Net Income of Full Time, Solo, Private Practice U.S. Dentists 1990 - 2004

Average net income has increased 117% since 1990

Average net income of general practitioners in 2004 was $185,090

Average net income of specialty practitioners in 2004 was $328,110

Average net income of new general practitioners in 2004 was $155,390 Source: American Dental Association, 2004 Survey of Dental Practice

slide-12
SLIDE 12

American Dental Education Association

Distribution of Professionally Active Dental Specialists, 2001

80% of professionally active dentists are generalists

20% are specialists

Source: American Dental Association

slide-13
SLIDE 13

American Dental Education Association

Professionally Active Dentists by Gender and Race/Ethnicity

Male 84% Female 16% Native American 0.1% Asian/Pacific Islander 7% Black/African American 3.5% Hispanic/Latino 3.5% White/Caucasian 86%

Women will comprise 30% of professionally active dentists by 2020

Based on current dental school enrollment trends and growth of the population by race/ethnicity, the future dental workforce will remain unrepresentative of the population to be served

Source: American Dental Association, Bureau of Health Professions, HRSA

slide-14
SLIDE 14

American Dental Education Association

Dental Health Professional Shortage Areas (D-HPSAs)

As designated by the U.S. Health Resources and Services Administration (HRSA), the number of D-HPSAs has grown from 792 in 1993 to 4,048 in 2008. Less than half of D-HPSAs are served by Federally Qualified Health Centers (FQHC), FQHC look-alikes, or rural health clinics.

Source: American Dental Education Association (ADEA)

slide-15
SLIDE 15

American Dental Education Association

Community Health Center Dental Programs

Health Centers, also known as Federally Qualified Health Centers (FQHC), are non-profit clinics that provide high-quality health care services to the underserved. Nationwide in 2008, Health Centers employed approximately 2,300 dentists and 900 dental hygienists (FTE). Over 850 Health Centers (80%) across the country offer on-site dental services. In 2008, Health Centers provided dental care to 3.1 million patients with 7.3 million visits. During that same year, Health Centers provided medical care to about 14.9 million patients.

Source: National Network for Oral Health Access (NNOHA)

slide-16
SLIDE 16

American Dental Education Association

Average Number of Patients Visits and New Patients Screened in United States Dental Schools, 2004-05 to 2008-09

5,696 6,106 6,085 5,722 6,246 54,397 53,298 56,427 54,688 52,272 10,000 20,000 30,000 40,000 50,000 60,000 2004-05 2005-06 2006-07 2007-08 2008-09 Number of Patients Year Patient Visits Patients Screened Source: American Dental Association, Survey Center, Surveys of Dental Education, 2008-09