? Sell Bonds sell bonds Yield High yield high 5% 1 buy Bonds - - PDF document

sell bonds sell bonds yield high yield high 5 1 buy bonds
SMART_READER_LITE
LIVE PREVIEW

? Sell Bonds sell bonds Yield High yield high 5% 1 buy Bonds - - PDF document

FOR PROFESSIONAL CLIENTS/WELL-INFORMED INVESTORS ONLY - NOT FOR RETAIL USE OR DISTRIBUTION i W Alternative SIF - Apis Resiliens INVESTMENT OBJECTIVE FUND HIGHLIGHTS Seek an annualized positjve


slide-1
SLIDE 1

iW PARTNERS

asset management - asset services - asset solutions

FOR PROFESSIONAL CLIENTS/WELL-INFORMED INVESTORS ONLY - NOT FOR RETAIL USE OR DISTRIBUTION

INVESTMENT OBJECTIVE

Seek an annualized positjve performance above EONIA1 in- fmatjon adjusted2 over its recommended minimum holding period of 3 years through the selectjon of specialized fund managers within a dynamic and fmexible allocatjon to alter- natjve investment strategies.

1 EONIA : Euro Overnight Index Average (a short term money market reference rate for the euro) 2 Infmatjon adjusted : Monthly infmatjon fjgures are taken from the Harmonised Index of Consumer Prices for the European Union

Equity Hedge

; ; Long/Short Equity ; ; Long/Short Credit ; ; Short Bias ; ; Convertjble Bonds ; ; …

Relatjve Value

; ; Equity Market Neutral ; ; Fixed Income Arbitrage ; ; Convertjble Arbitrage ; ; …

Global Assets

; ; Global Macro ; ; CTA/Managed Futures ; ; Emerging Market ; ; …

Event Driven

; ; Merger Arbitrage ; ; Distressed Securitjes ; ; Actjvist Shareholder ; ; Special Situatjons ; ; …

FUND HIGHLIGHTS

  • Optjmized risk return allocatjon to alternatjve strategies,

low correlatjon to traditjonal asset classes

  • Focus on independent managers who have demonstrated

best-in-class skills in various market conditjons

  • Target Performance : EONIA1 infmatjon adjusted2
  • Experienced investment team in open architecture plat-

forms

WHY ALTERNATIVE STRATEGIES INVESTMENT THESIS

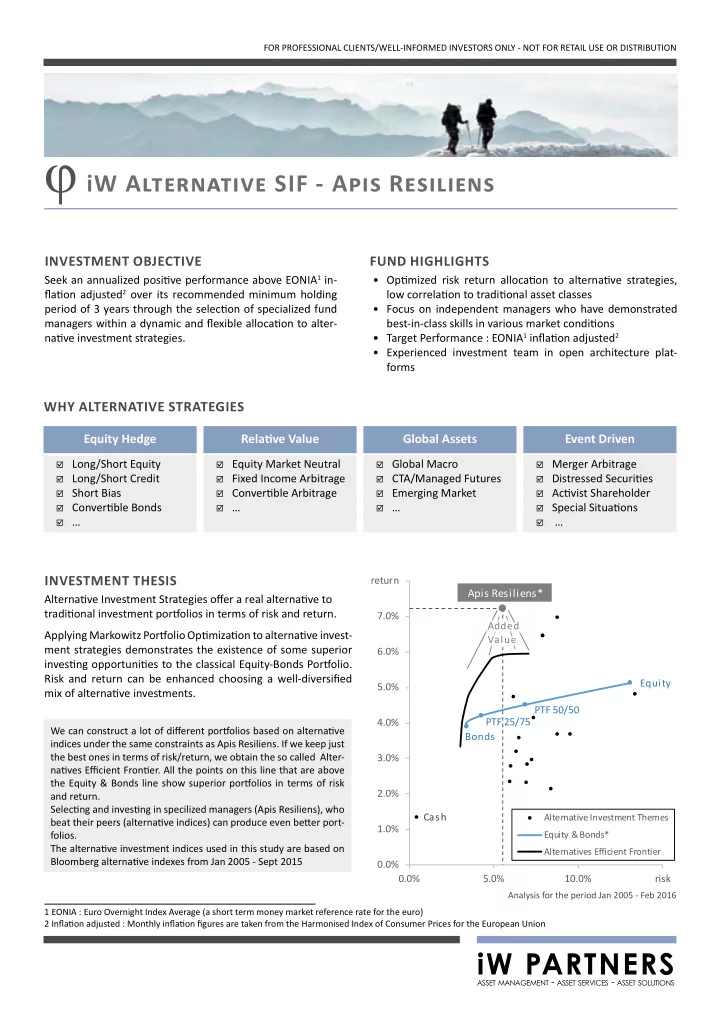
Alternatjve Investment Strategies ofger a real alternatjve to traditjonal investment portgolios in terms of risk and return. Applying Markowitz Portgolio Optjmizatjon to alternatjve invest- ment strategies demonstrates the existence of some superior investjng opportunitjes to the classical Equity-Bonds Portgolio. Risk and return can be enhanced choosing a well-diversifjed mix of alternatjve investments.

We can construct a lot of difgerent portgolios based on alternatjve indices under the same constraints as Apis Resiliens. If we keep just the best ones in terms of risk/return, we obtain the so called Alter- natjves Effjcient Frontjer. All the points on this line that are above the Equity & Bonds line show superior portgolios in terms of risk and return. Selectjng and investjng in specilized managers (Apis Resiliens), who beat their peers (alternatjve indices) can produce even betuer port- folios. The alternatjve investment indices used in this study are based on Bloomberg alternatjve indexes from Jan 2005 - Sept 2015

Analysis for the period Jan 2005 - Feb 2016

Apis Resiliens*

Cash Bonds ​​ ​ ​PTF 25/75 ​ ​ ​ ​ PTF 50/50 ​ ​ ​ ​ ​ ​ ​ ​ ​ Equity 0.0% 1.0% 2.0% 3.0% 4.0% 5.0% 6.0% 7.0% return 0.0% 5.0% 10.0% risk

Alternative Investment Themes Equity & Bonds* Alternatives Efficient Frontier

Added Value

φ iW Alternative SIF - Apis Resiliens

slide-2
SLIDE 2

iW PARTNERS

asset management - asset services - asset solutions

iW Alternatjve SIF - Apis Resiliens

  • 60%
  • 40%
  • 20%

0% 0% 5% 10% 15%

1 10 100

  • 1900

1910 1920 1930 1940 1950 1960 1970 1980 1990 2000 2010 2020

Nominal Yield Drawdowns in real terms Index in real terms (rhs)

Buy Bonds Sell Bonds Yield High Yield High Yield Low Yield Low Sell Bonds Buy Bonds

INVESTMENT PROCESS

The key to betuer performance is to fjnd managers among their peers who can produce consistent positjve style-adjusted alp- has.

  • Defjning manager universe: Identjfjcatjon of suitable mana-

gers.

  • Selectjon and due-diligence of target managers
  • Risk return optjmized portgolio constructjon of complemen-

tary managers

  • Frequent monitoring and manager review to identjfy warn-

ing signs of adverse changes

RISK MANAGEMENT

  • At least 3 alternatjve strategies
  • Any strategy should not, exceed 50% of the portgolio
  • All target funds have at least a monthly dealing frequency
  • Maintain a shortlist of potentjal substjtute managers

SELECTION OF TARGET MANAGERS

Market Opportunity What is the opportunity and why is it there? Investment Process We identjfy best practjces and competjtjve ad- vantages among similar managers Organizatjon Are research, trading, risk management and

  • peratjons properly stafged given the invest-

ment process and scale? Is compensatjon fair? Has there been turnover? People We speak at length to the principals face to

  • face. We look for experience, intelligence and
  • integrity. We keep intjmate familiarity with the

manager’s investment philosophy, skills, style and market views Terms and Structure Are the terms fair, are interests aligned? Legal We check the reputatjon of the service provi- ders and carefully check the fund’s documen- tatjon Track record Historical performance appraisal compared to its peers.

HISTORICAL PERSPECTIVE ON BONDS

US Long Government Bonds in real terms from 1900 to 2014 with 10 year constant maturity yield

CURRENT PERSPECTIVE ON BONDS

The present interest rates ofger very low potentjal returns. Higher returns can only be obtained by taking substantjally more risk, by choosing less quality or longer maturity bonds D = Duratjon

Duratjon is the approximate percentage change in price for a 100 basis point change in rates. The price of a bond with a duratjon of 7.6 will fall 7.6% if its yield raises by 1% 40 year bond bear market yield high yield Low yield Low ready for the coming bond dark age? buy bonds buy Bonds yield high sell bonds sell bonds

?

Bloomberg 20 June 2016 Source : Elroy Dimson, Paul Marsh, Mike Staunton & Robert J. Schiller

D=2,3 D=3,3 D=1,9 D=3,8 D=5,5 D=7,5 D=10,5 D=1,9 D=3,8 D=5,5 D=7,6 D=1.9 D=3,7 D=5,5 D=7,7 D=10,3 D=17,3

  • 1%

0% 1% 2% 3% 4% 5% 5 10 15 20 25

Yield to Worst

Years to Maturity

Euro High Yield BBB Euro Corporate Index Euro Corporate Euro Government

slide-3
SLIDE 3

iW PARTNERS

asset management - asset services - asset solutions

FOR PROFESSIONAL CLIENTS/WELL-INFORMED INVESTORS ONLY - NOT FOR RETAIL USE OR DISTRIBUTION

SIMULATED TRACKRECORD

Year Jan Feb Mrt Apr Mei Jun Jul Aug Sep Okt Nov Dec Apis Resiliens* Apis Resiliens BM* Bonds* Equity Bonds 50/50* Equity* 2005 0.7%

  • 0.4%
  • 2.2%

3.1% 0.6% 1.8%

  • 0.2%

2.5%

  • 1.1%

2.0% 1.6% 8.7% 6.9% 3.0% 12.0% 22.2% 2006 2.5% 0.2% 1.2% 0.8%

  • 3.5%

0.5%

  • 0.5%

1.7% 0.5% 1.4% 0.9% 1.0% 6.8% 12.3%

  • 0.9%

2.2% 5.9% 2007 0.4% 1.1% 2.4% 0.9% 1.4% 1.1% 0.6%

  • 0.8%

2.7% 3.3%

  • 0.9%

0.5% 13.4% 9.2% 0.8%

  • 1.3%
  • 3.1%

2008

  • 4.1%

1.0% 0.4% 1.8% 1.7%

  • 0.1%
  • 0.6%
  • 1.8%
  • 3.6%
  • 4.1%
  • 0.5%

3.0%

  • 6.8%
  • 10.8%

5.3%

  • 19.2%
  • 38.6%

2009 1.1%

  • 0.6%

4.2% 5.3% 2.8% 0.4% 3.7% 2.6% 3.0%

  • 0.3%

1.7% 1.8% 28.8% 15.7% 6.3% 14.9% 24.2% 2010

  • 1.3%

1.4% 3.2% 0.6%

  • 1.8%
  • 0.5%

2.6% 0.1% 2.4% 1.1%

  • 0.1%

1.7% 9.6% 6.8% 1.5% 9.2% 17.8% 2011

  • 1.1%

1.1% 0.1% 1.4%

  • 1.1%
  • 1.2%

1.1%

  • 3.1%
  • 2.3%

3.9%

  • 0.8%
  • 0.1%
  • 2.1%
  • 3.8%

2.5%

  • 0.8%
  • 3.8%

2012 3.4% 2.6% 1.6%

  • 1.1%
  • 2.8%

0.9% 1.4% 0.6% 0.9%

  • 1.2%

1.1% 0.8% 8.1% 3.9% 10.4% 11.1% 12.4% 2013 1.1%

  • 0.4%

0.9% 0.0% 0.9%

  • 1.8%

2.0% 0.1% 2.0% 1.9% 0.4% 1.1% 8.4% 5.2% 1.5% 9.8% 19.5% 2014 1.1% 2.5%

  • 1.6%
  • 1.0%

1.3%

  • 0.1%
  • 0.6%

1.5%

  • 0.1%

0.1% 0.9% 0.0% 4.0% 2.0% 10.3% 13.6% 17.8% 2015 1.8% 1.1% 1.2%

  • 1.4%

0.1% 0.3% 3.0%

  • 0.5%

0.4% 0.3% 1.0%

  • 0.7%

6.7% 2.4% 0.3% 4.4% 8.9% 2016

  • 0.3%
  • 1.2%
  • 1.5%
  • 1.3%

2.3%

  • 2.4%
  • 6.9%

Number of months 133 133 133 133 133 Annualized return 7.2% 4.1% 3.9% 4.3% 5.1% Volatjlity 5.8% 5.6% 3.4% 6.9% 13.1% Best Month 5.3% 4.0% 3.1% 6.1% 11.3% Worst Month

  • 4.1%
  • 5.2%
  • 2.4%
  • 5.3%
  • 10.3%

Best 1Y Rolling 30.4% 18.6% 13.1% 26.3% 47.4% Worst 1Y Rolling

  • 9.4%
  • 12.4%
  • 3.0%
  • 19.8%
  • 38.6%

Best 2Y Rolling 43.0% 29.7% 16.5% 34.1% 67.8% Worst 2Y Rolling 3.6%

  • 3.9%
  • 2.6%
  • 25.0%
  • 46.9%

Best 3Y Rolling 45.7% 38.3% 26.5% 42.4% 73.5% Worst 3Y Rolling 10.5% 2.6%

  • 1.5%
  • 23.9%
  • 45.3%

* afuer estjmated average fees EQUITY : MSCI Net TR World Euro BONDS : BofA Merril Lynch Euro Broad Market Index APIS RESILIENS BM: Apis Resiliens’ target funds are replaced by alternatjve strategy indices from bloomberg respectjng the same weights to difgerent alternatjve strategies

  • 50%
  • 40%
  • 30%
  • 20%
  • 10%
  • 0%

2005 2006 2007 2008 2009 2010 2011 2012 2013 2014 2015 2016 80 100 120 140 160 180 200 220 Apis Resiliens* Apis Resiliens BM EONIA Bonds* Equity Bonds 50/50* Equity*

 Drawdowns Total return evolution 

slide-4
SLIDE 4

iW PARTNERS

asset management - asset services - asset solutions

iW Alternatjve SIF - Apis Resiliens FOR PROFESSIONAL CLIENTS/WELL-INFORMED INVESTORS ONLY - NOT FOR RETAIL USE OR DISTRIBUTION Note: This document is not directed to, or intended for distributjon to or use by, any person or entjty who is a citjzen or resident of, or located in, any locality, state, country or other jurisdictjon where such distributjon, publicatjon, availability or use would be contrary to law or regulatjon. Additjonal informatjon is available upon request. The informatjon, tools and material presented in this document are provided for informatjon purposes only and are not to be used or considered as an ofger or solicitatjon to buy, sell or subscribe any securitjes or other fjnancial instruments. Past performance should not be taken as an indicatjon or guarantee of future perfor- mance and no representatjon or warranty, expressed or implied, is made by iW Alternatjve General Partner (‘iW’) regarding future performance. Informatjon found in this report has been prepared based on informatjon provided by various fjnancial sources. Informatjon usually atuributable to a unique specifjc source is quoted whenever such informatjon is available. Otherwise, the informatjon may have been gathered from public news disseminatjon services such as Bloomberg, Reuters

  • r any other news services.

Informatjon and opinions presented by iW have been obtained from sources believed to be reliable, and, although all reasonable care has been taken, iW is not able to make any representatjon as to its accuracy or completeness. Accordingly, iW accepts no liability for loss arising from the use of this document presented for informatjon purposes only. iW has no obligatjon to update, modify or amend this report or otherwise notjfy a reader thereof in the event that any matuer stated herein becomes inaccurate.

Jean-Charles de le Court 20 years of industry experience Has more than 20 years of solid experience in third partjes’ fund selectjon Industry (especially in the mentjoned Alternatjve Strategies) Born in 1969, Jean-Charles was, in the late ’90s, senior portgolio manager of the awar- ded bond, money market and mixed funds of the KBL-EPB Group in Luxembourg. From 2002 to 2006, he acted as a senior portgolio manager with Petercam in Brussels, where he set up and managed the open-architecture products. In 2005, Jean-Charles launched the fund of funds Apis Lucrosa Ltd for a group of families and fjnally joined the Management Board of iW Alternatjve General Partner sàrl (« iW GP ») in 2012. In 2014, Jean-Charles supervised the 2014 incorporatjon of Apis Lucrosa Ltd in the umbrella iW Alternatjve SIF (« iW SIF ») – Apis Lucrosa sub-fund and is today the in- vestment manager of this sub-fund. Jean-Charles holds a Master Degree in Economics from the University of Namur and a post-graduate degree in Internatjonal Relatjons from the University of Vienna.

INVESTMENT MANAGER

Fund Type SIF SICAV (AIF) Share class Management Fee Domicile Luxembourg P EUR 1.4% Custodian Pictet & Cie (Europe) S.A. Central Administratjon FundPartner Solutjons (Europe) S.A. Auditors Ernst & Young Luxembourg S.A. Further Informatjon iw-partners.com Fund Manager iW Alternatjve General Partner S.à.r.l. Index1 EONIA2 infmatjon adjusted3 NAV available trough iW Partners Website, Bloomberg, SIX Telek- urs, Fundsquare Liquidity Weekly Performance fee 5% with high watermark

1 Please note that the reference to the index is made for informatjon purposes only. The index is not mentjoned in the investment policy of the Sub-Fund 2 EONIA : Euro Overnight Index Average (a short term money market reference rate for the euro) 3 Infmatjon adjusted : Monthly infmatjon fjgures are taken from the Harmonised Index of Consumer Prices for the European Union

slide-5
SLIDE 5

iW PARTNERS

asset management - asset services - asset solutions

Alternative Strategies Dictionary

Relatjve Value

strategies seek to profjt from a pricing discrepancy between related securitjes with the objectjve to hedge out directj-

  • nal risk. This typically involves buying

and selling related securitjes.

; ; Equity Market Neutral

strategies seek to exploit pricing ineffjciencies between related equity securitjes ba- sed on quantjtatjve (technical) and/or fundamental analysis while at the same tjme neutralizing exposure to market risk. This can be done explicitly by paring each long positjon with a short one that is expected to respond similarly (but worse) to overall market movements.

; ; Fixed Income Arbitrage

strategies use a wide spectrum of strategies that seek to exploit pricing anomalies with and across global fjxed income markets.

; ; Convertjble Arbitrage

strategies seek to exploit perceived mispricing between convertjble bonds and their component parts. The strategy typically involves buying convertjble debt securitjes and simultaneously shortjng the issuer’s stock.

Equity Hedge

strategies are mostly focused on public equity markets. They use a “botuom up” approach, analyzing individual compa- nies or sectors to identjfy overvalued and undervalued securitjes and take directjo- nal bets accordingly. They take long and short positjons in equity, equity derivatj- ves and credit instruments with varying degrees of exposure and leverage. These strategies gain or lose when their under- lying markets or securitjes move in one directjon or another.

; ; Long/Short Equity

strategies invest in equitjes, and combine long investments with short sales to reduce but not completely eliminate market exposure.

; ; Long/Short Credit

strategies take exposure in credit sensitjve instruments based on credit and sector assessments of the issuers as well as technical factors in markets.

; ; Short Bias

strategies have a net short orientatjon. They use quantjtatjve (technical) and/or fun- damental analysis to identjfy overvalued equity securitjes The fund typically varies its net short exposure based upon market expectatjons, going fully short in declining markets.

; ; Convertjble Bonds

strategies seek to take advantage of the natural asymmetry of convertjble bonds. They take directjonal views on equity which can be long only and/or leveraged while at the same tjme controlling the equity risk.

slide-6
SLIDE 6

iW PARTNERS

asset management - asset services - asset solutions

Global Assets

strategies focus on broad markets and broad themes. They generally invest in global stocks, bonds, currencies and commodity markets. Their analysis and decision-making can be quantjtatjve or discretjonary.

; ; Global Macro

strategies emphasize a “top down” approach to identjfy economic trends evolving across the world and tend to make leveraged, directjonal and opportunistjc invest- ments to take advantage of systematjc moves.

; ; CTA/Managed Futures

strategies are dominated by systematjc trend following that seek to profjt through the quantjtatjve predictjon of market trends. They trade primarily listed commodity and fjnancial futures contracts, mostly on an algorithmic basis.

; ; Emerging Market

strategies specialize their investments in the securitjes of emerging market countries. They ofger exposure to sophistjcated investments, including commoditjes, real estate, currencies and derivatjves and can also use leverage.

Event-Driven

strategies seek to profjt from short- term events, typically involving potentjal changes in corporate structure such as an acquisitjon or restructuring, that are expected to afgect individual companies. It is considered a “botuom up” strategy and involves intensive legal analysis of specifjc transactjons. Investments may include long and short positjons in com- mon and preferred stocks, as well as debt securitjes and optjons.

; ; Merger Arbitrage (Risk Arbitrage)

strategies seek to take advantage of special opportunitjes that arise when companies decide to acquire, or merge with, other companies. Generally, this involves going long the stock of the company being acquired and going short the stock of the acquiring company when the merger/acquisitjon is announced.

; ; Distressed Securitjes

strategies focus on the securitjes of companies either in bankruptcy or perceived to be near to bankruptcy. The fund may go long fjxed income securitjes trading at a sig- nifjcant discount. Another strategy is to go long senior debt and short junior debt in

  • rder to profjt from a widening spread. The fund may also short the company’s stock.

; ; Actjvist Shareholder

strategies focus on acquiring suffjcient equity in order to infmuence a company’s poli- cies or directjon. The fund may advocate for divestures, restructuring, capital distribu- tjons to shareholders, and/or changes in management and company strategy.

; ; Special Situatjons

strategies focus on opportunitjes in the equity of companies that are currently enga- ged in restructuring actjvitjes other than merger/acquisitjons and bankruptcy. These actjvitjes include security issuance/repurchase, special capital distributjons, and asset sales/spin-ofgs.

Alternative Strategies Dictionary