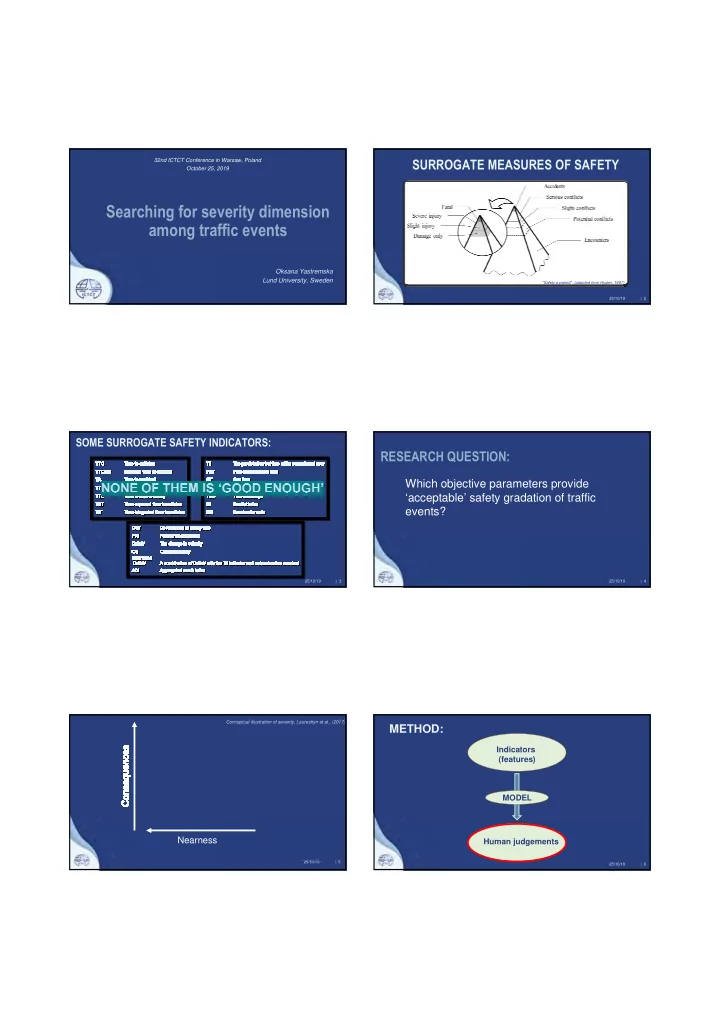

SURROGATE MEASURES OF SAFETY 32nd ICTCT Conference in Warsaw, Poland October 25, 2019 Searching for severity dimension among traffic events Oksana Yastremska Lund University, Sweden "Safety pyramid", (adopted from Hyden, 1987) 25/10/19 | 2 SOME SURROGATE SAFETY INDICATORS: RESEARCH QUESTION: Which objective parameters provide ‘acceptable’ safety gradation of traffic events? 25/10/19 | 3 25/10/19 | 4 Conceptual illustration of severity, Laureshyn et al., (2017) METHOD: Indicators (features) MODEL Nearness Human judgements 25/10/19 | 5 25/10/19 | 6
HUMANS’ JUDGEMENTS: COMPARISON GROUPS: ‘Car – car’ vs. ‘Car – cyclist’ vs. ‘Car – car’ ‘Car – cyclist’ ‘Car – car’ vs. ‘Car – cyclist’ 25/10/19 | 7 25/10/19 | 8 Indicators Initial conditions (features) Model Yes No Evasive action Human judgements Culmination 25/10/19 | 9 25/10/19 | 10 FEATURES: Indicators (features) Initial Intensity of Culmination conditions evasive action Model - T2; - T2min; LOGISTIC REGRESSION - distanc - Decelerati - PET; e; on - distanc - DeltaV0 e; Human judgements ; - DeltaV0 - E ; - E 25/10/19 | 11 25/10/19 | 12
ANALYSIS OF EACH FEATURE SEPARATELY: FEATURES HUMAN JUDGEMENTS ... A B C … More Binary T2 ... 1,15 1,63 0,89 ... Pair severe classifier DeltaV0 (T2) ... 4,9 5,3 5,4 ... Emax (T2) ... 208,809 250,9 250,895 ... A B A 1 Distance (T2) ... 8,66175 9,9532 7,9734 ... C D D 0 T2min ... 3,34378 0,4643 2,92312 ... E F E 1 DelvaV0 (T2min) ... 2,6 6,9 1,5 ... G H H 0 Emax(T2min) ... 60,5422 422,87 19,7689 ... … … … … Distance (T2min) ... 6,93876 4,0455 4,63004 ... … … … … PET ... 1,15783 0,3582 2,54086 ... Av. Deceleration ... 5,6475 0,7298 4,23107 ... … … … … A B lin(x)=wx+b 1,15 1,63 4,9 5,3 T T S(X A ) > S(X B ) if w X A >w X B 208,81 250,9 X A = X B = 8,6618 9,9532 3,3438 0,4643 2,6 6,9 60,542 422,87 6,9388 4,0455 1,1578 0,3582 5,6475 0,7298 25/10/19 | 13 25/10/19 | 14 ANALYSIS OF EACH FEATURE GROUP SEPARATELY: CORRELATIONS OF ALL INDICATORS TOGETHER: Moment of Moment of initial Intensity of evasive ‘culmination’ conditions action 25/10/19 | 15 | 16 First conclusions: • No clear winner or loser among single indicators • Combinations perform better than single indicators Oksana Yastremska Transport & Roads • Still 20 % are not explained – why? Department of Technology & Society Faculty of Engineering, LTH Lund University • More indicators oksana.yastremska@tft.lth.se • More training data • Inter-observer reliability 25/10/19 | 17 25/10/19 | 18
Recommend
More recommend