
SLIDE 1
Source: ESA/University of Exeter/ARGANS
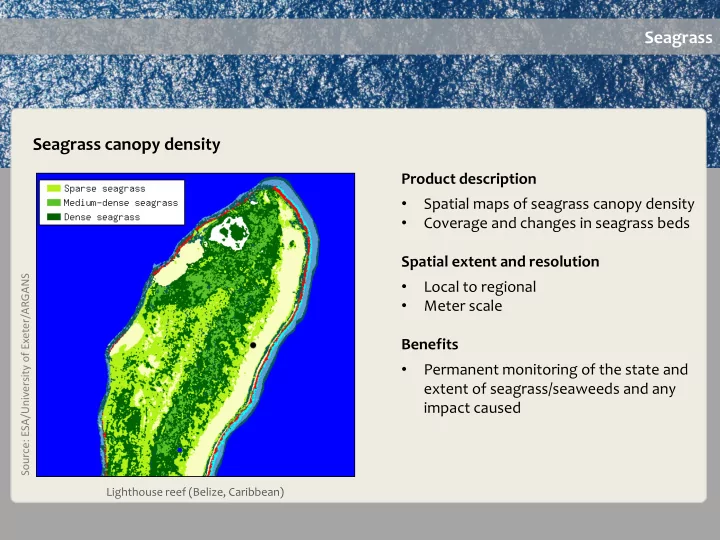
Seagrass Seagrass canopy density
Lighthouse reef (Belize, Caribbean)
Product description
- Spatial maps of seagrass canopy density
- Coverage and changes in seagrass beds
Spatial extent and resolution
- Local to regional
- Meter scale
Benefits
- Permanent monitoring of the state and