
SLIDE 1
Scientific Figures
CASCA 2017 Graduate Student Workshop
Rodrigo Fernández - University of Alberta
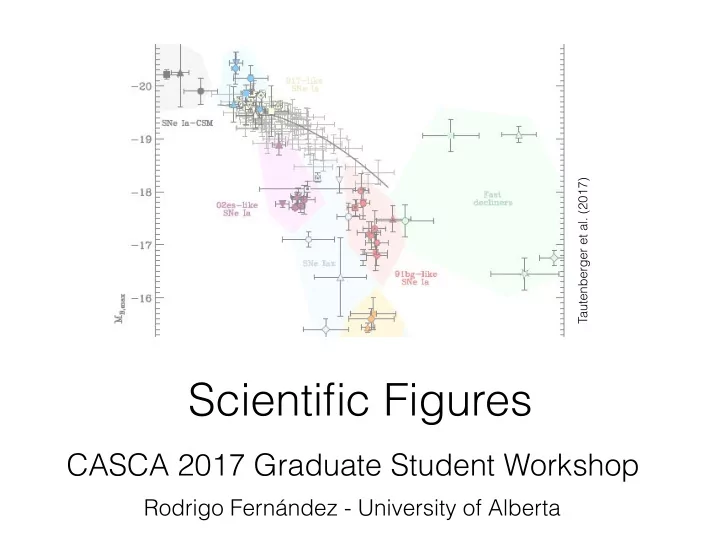
Tautenberger et al. (2017)
Scientific Figures CASCA 2017 Graduate Student Workshop Rodrigo - - PowerPoint PPT Presentation
Tautenberger et al. (2017) Scientific Figures CASCA 2017 Graduate Student Workshop Rodrigo Fernndez - University of Alberta Overview 1. Frame of mind: audience first 2. Think strategically: tell a story 3. Developing your toolbox Rodrigo
Tautenberger et al. (2017)
Rodrigo Fernández - CASCA 2017 Graduate Student Workshop
Rodrigo Fernández - CASCA 2017 Graduate Student Workshop
Rodrigo Fernández - CASCA 2017 Graduate Student Workshop Müller, Janka, & Heger (2012)
Rodrigo Fernández - CASCA 2017 Graduate Student Workshop
Rodrigo Fernández - CASCA 2017 Graduate Student Workshop
Rodrigo Fernández - CASCA 2017 Graduate Student Workshop
Rodrigo Fernández - CASCA 2017 Graduate Student Workshop
Rodrigo Fernández - CASCA 2017 Graduate Student Workshop
Rodrigo Fernández - CASCA 2017 Graduate Student Workshop
Jenny & Kelso (2007) colororacle.org/design.html
Rodrigo Fernández - CASCA 2017 Graduate Student Workshop
Jenny & Kelso (2007) colororacle.org/design.html
Rodrigo Fernández - CASCA 2017 Graduate Student Workshop
Rodrigo Fernández - CASCA 2017 Graduate Student Workshop
Rodrigo Fernández - CASCA 2017 Graduate Student Workshop
Rodrigo Fernández - CASCA 2017 Graduate Student Workshop
Ian McCaig (pinterest)
Rodrigo Fernández - CASCA 2017 Graduate Student Workshop
Rodrigo Fernández - CASCA 2017 Graduate Student Workshop
10−3 10−2 10−1 100 101 102
time [s]
−0.002 0.000 0.002 0.004 0.006 0.008 0.010
[MB(t)+Mdom(t)]/[MB(0)+Mdom(0)]−1
∆r/r = 3.7% ∆r/r = 1.8% ∆r/r = 0.9%
RF et al. in prep
Rodrigo Fernández - CASCA 2017 Graduate Student Workshop
Tautenberger (2017), arXiv: 1703.00528
Example: types of SN Ia 2) Uses color to divide sets
Rodrigo Fernández - CASCA 2017 Graduate Student Workshop
Rodrigo Fernández - CASCA 2017 Graduate Student Workshop
The first tool in your arsenal is your memory. Read lots of papers, all the time. Set aside those that you consider particularly good, either because the science is great (=classic paper) or because the writing or figures are particularly good. Keep this list of exemplars for reference.
Rodrigo Fernández - CASCA 2017 Graduate Student Workshop
Rodrigo Fernández - CASCA 2017 Graduate Student Workshop
Rodrigo Fernández - CASCA 2017 Graduate Student Workshop
Rodrigo Fernández - CASCA 2017 Graduate Student Workshop
Rodrigo Fernández - CASCA 2017 Graduate Student Workshop
Rodrigo Fernández - CASCA 2017 Graduate Student Workshop
Rodrigo Fernández - CASCA 2017 Graduate Student Workshop
Rodrigo Fernández - CASCA 2017 Graduate Student Workshop
1 2 z [107 cm] (a) t = 0 (b) 0.7 ms (c) 2.2 ms (d) 6.5 ms 1 2 3 x [107 cm]
1 z [107 cm] (e) 11 ms 1 2 3 x [107 cm] (f) 15 ms 1 2 3 x [107 cm] (g) 22 ms 1 2 3 4 x [107 cm] (h) 43 ms 105 107 109 1011 disk [g cm−3] 105 107 109 1011 fallback [g cm−3] 105 107 109 1011 unbound tail [g cm−3]
RF et al. (2016)
Rodrigo Fernández - CASCA 2017 Graduate Student Workshop Lentz et al. (2015)
Rodrigo Fernández - CASCA 2017 Graduate Student Workshop