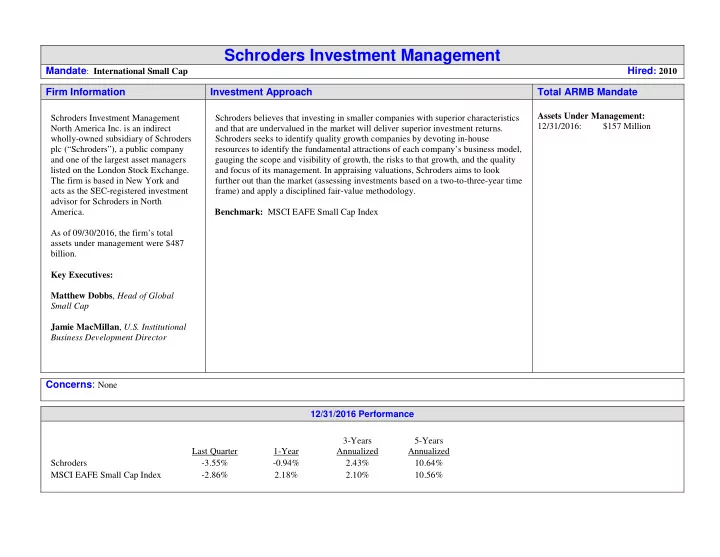

Schroders Investment Management
Mandate: International Small Cap
Hired: 2010
Firm Information Investment Approach Total ARMB Mandate
Schroders Investment Management North America Inc. is an indirect wholly-owned subsidiary of Schroders plc (“Schroders”), a public company and one of the largest asset managers listed on the London Stock Exchange. The firm is based in New York and acts as the SEC-registered investment advisor for Schroders in North America. As of 09/30/2016, the firm’s total assets under management were $487 billion. Key Executives: Matthew Dobbs, Head of Global Small Cap Jamie MacMillan, U.S. Institutional Business Development Director Schroders believes that investing in smaller companies with superior characteristics and that are undervalued in the market will deliver superior investment returns. Schroders seeks to identify quality growth companies by devoting in-house resources to identify the fundamental attractions of each company’s business model, gauging the scope and visibility of growth, the risks to that growth, and the quality and focus of its management. In appraising valuations, Schroders aims to look further out than the market (assessing investments based on a two-to-three-year time frame) and apply a disciplined fair-value methodology. Benchmark: MSCI EAFE Small Cap Index Assets Under Management: 12/31/2016: $157 Million
Concerns: None
12/31/2016 Performance Last Quarter 1-Year 3-Years Annualized 5-Years Annualized Schroders
- 3.55%
- 0.94%
2.43% 10.64% MSCI EAFE Small Cap Index
- 2.86%
2.18% 2.10% 10.56%