SCARC 2015 Presentation Descriptions Presenter Title Description - - PDF document

scarc 2015 presentation descriptions
SMART_READER_LITE
LIVE PREVIEW

SCARC 2015 Presentation Descriptions Presenter Title Description - - PDF document

SCARC 2015 Presentation Descriptions Presenter Title Description Topic Area You receive a request to geocode a table of addresses. Unfortunately, the DBMS is legacy & only exports to a preformatted cvs file or, even better, the data is in


slide-1
SLIDE 1

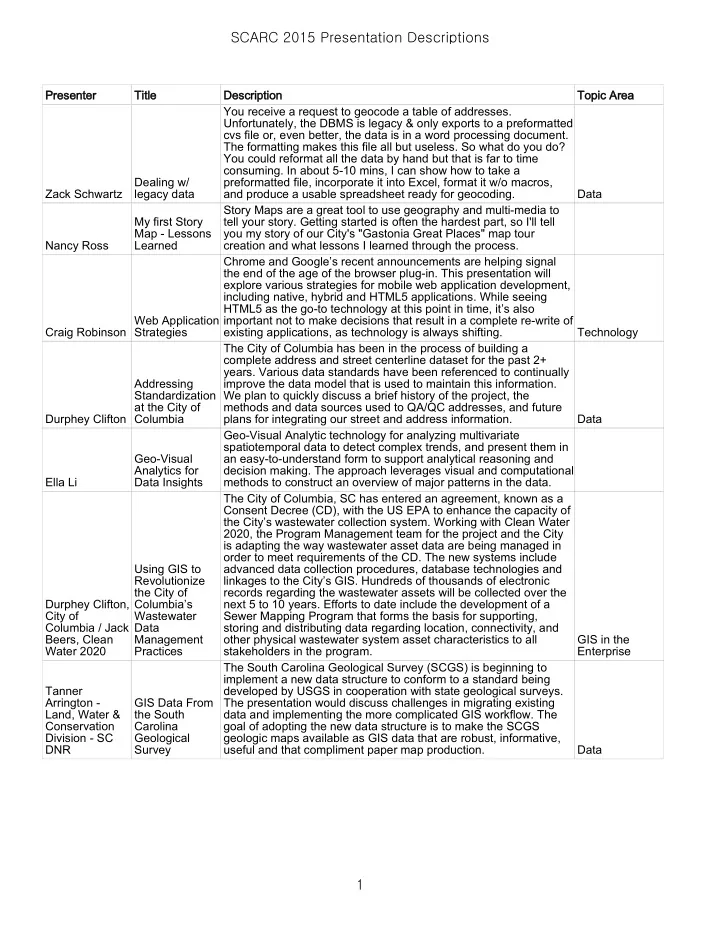
Presenter Title Description Topic Area Zack Schwartz Dealing w/ legacy data You receive a request to geocode a table of addresses. Unfortunately, the DBMS is legacy & only exports to a preformatted cvs file or, even better, the data is in a word processing document. The formatting makes this file all but useless. So what do you do? You could reformat all the data by hand but that is far to time

  • consuming. In about 5-10 mins, I can show how to take a

preformatted file, incorporate it into Excel, format it w/o macros, and produce a usable spreadsheet ready for geocoding. Data Nancy Ross My first Story Map - Lessons Learned Story Maps are a great tool to use geography and multi-media to tell your story. Getting started is often the hardest part, so I'll tell you my story of our City's "Gastonia Great Places" map tour creation and what lessons I learned through the process. Craig Robinson Web Application Strategies Chrome and Google’s recent announcements are helping signal the end of the age of the browser plug-in. This presentation will explore various strategies for mobile web application development, including native, hybrid and HTML5 applications. While seeing HTML5 as the go-to technology at this point in time, it’s also important not to make decisions that result in a complete re-write of existing applications, as technology is always shifting. Technology Durphey Clifton Addressing Standardization at the City of Columbia The City of Columbia has been in the process of building a complete address and street centerline dataset for the past 2+

  • years. Various data standards have been referenced to continually

improve the data model that is used to maintain this information. We plan to quickly discuss a brief history of the project, the methods and data sources used to QA/QC addresses, and future plans for integrating our street and address information. Data Ella Li Geo-Visual Analytics for Data Insights Geo-Visual Analytic technology for analyzing multivariate spatiotemporal data to detect complex trends, and present them in an easy-to-understand form to support analytical reasoning and decision making. The approach leverages visual and computational methods to construct an overview of major patterns in the data. Durphey Clifton, City of Columbia / Jack Beers, Clean Water 2020 Using GIS to Revolutionize the City of Columbia’s Wastewater Data Management Practices The City of Columbia, SC has entered an agreement, known as a Consent Decree (CD), with the US EPA to enhance the capacity of the City’s wastewater collection system. Working with Clean Water 2020, the Program Management team for the project and the City is adapting the way wastewater asset data are being managed in

  • rder to meet requirements of the CD. The new systems include

advanced data collection procedures, database technologies and linkages to the City’s GIS. Hundreds of thousands of electronic records regarding the wastewater assets will be collected over the next 5 to 10 years. Efforts to date include the development of a Sewer Mapping Program that forms the basis for supporting, storing and distributing data regarding location, connectivity, and

  • ther physical wastewater system asset characteristics to all

stakeholders in the program. GIS in the Enterprise Tanner Arrington - Land, Water & Conservation Division - SC DNR GIS Data From the South Carolina Geological Survey The South Carolina Geological Survey (SCGS) is beginning to implement a new data structure to conform to a standard being developed by USGS in cooperation with state geological surveys. The presentation would discuss challenges in migrating existing data and implementing the more complicated GIS workflow. The goal of adopting the new data structure is to make the SCGS geologic maps available as GIS data that are robust, informative, useful and that compliment paper map production. Data

SCARC 2015 Presentation Descriptions 1

slide-2
SLIDE 2

Russell Patterson, GISP and Steven Gottula Emergency Response Tools for a Common Operating Picture in the Emergency Operations Center

  • Mr. Steven Gottula (Joint Base Charleston Emergency Manager)

and Mr. Russell Patterson, GISP will provide a Presentation that focuses on the use and role of an ArcGIS Server customization to support real-time situational awareness and a common operating picture during and after an emergency response. Focus will be less

  • n the actual technology and more about the principles and

practices for providing decision makers with a status map which can easily funnel into an after-action / hot-wash document. Applications Esri Staff What's new in 10.3 Applications Esri Staff Modeling and Visualization w/ 3d GIS Applications Esri Staff

  • Intro. to ArcGIS

Pro Applications Esri Staff Mobile Data Collection w/ArcGIS Online/Collector

  • Best Practices

Applications Erica Pfister- Altschul & Kathryn Butler Automating Parcel Analysis We used a python script to simplify the process of asset analysis for new annexations within city boundaries across the state of South Carolina. This demonstrated the advantages of expanding python script capabilities, allowing GIS personnel to be more effective and efficient. Applications Dawn Misura and Amanda Wheelis 2014 SC Gap Analysis - Protected Areas Database Development In 2014, the South Carolina Department of Natural Resources began an update on the State’s data contribution to the USGS National Gap Analysis Program. This endeavor involved working with each County’s assessor and / or GIS offices to identify publicly protected natural and recreational parcels to include in the Protected Areas Database (PADUS). This presentation will highlight the inherent difficulties and ultimate success in conducting a large- scale, multi-contributor, spatial data collection and aggregation project. Data Kathryn Butler The Incredible Potential of Volunteered Geographic Information I participaed in the “USGS iCoast - Did the Coast Change?”, a USGS research project to construct and deploy a citizen science web application that asks volunteers to compare pre- and post- storm aerial photographs and identify coastal changes using predefined tags. This crowdsourced data will help USGS improve predictive models of coastal change and educate the public about coastal vulnerability to extreme storms. I would like to give a quick 5 min breif on how each photo was tagged and what the USGS plans to accomplish with each classification. Data Jessica Boynton Coastal Applications SCDHEC - OCRM has created a number of public web and mobile applications to promote public beach access, increase the understanding of state beachfront jurisdictional areas, and enhance the knowledge of coastal dynamics. Technology Dan Morath, GISP Benchmarking Disaster Recovery: Mobile Data Collection using Collector for ArcGIS The Hazards & Vulnerability Research Institute (HVRI) at the University of South Carolina has been at the forefront of long-term recovery assessment and tracking since the catastrophe brought

  • n by Hurricane Katrina in 2005. Its mission includes the creation
  • f new methods and metrics to assist all levels of government with

preparedness, response, and recovery from disasters. This presentation highlights the use of the Collector app for ArcGIS in tandem with ArcGIS Online for collaborative mobile data collection and field recovery assessment along the New Jersey Coast following Hurricane Sandy. Tracy McKee Creating a GIS Data Portal In 2014 the City released publicly available GIS data portal. Why and how did we do it?

SCARC 2015 Presentation Descriptions 2

slide-3
SLIDE 3

Will Draper, GISP To efficiency and beyond! What is efficiency and why do I care? Don't you want to be an extraordinary mapper! This presentation will focus on approaches to being more efficient using sound project management and GIS workflow specifically using ArcGIS ModelBuilder. Applications Durphey Clifton & Karen Kustafik Making Connections: City of Columbia Stormwater and GIS Presentation Description: The City of Columbia recently completed a five year Phase One NPDES Permit for its MS4 (Municipal Separate Storm Sewer System). Effective on January 25, 2010, the permit contained eleven elements that included requirements to inventory stormwater

  • utfalls and structural controls, walk all USGS Blue Line Streams

within City jurisdiction and perform dry weather screening. At the inception of the program, the focus was on mapping outfalls to USGS waterways but staff soon realized the value of working to create a connected linear network in order to fully take advantage of analytical capabilities of GIS. Learn what we have learned about relevant connections between the MS4 and GIS, the data model development, and the potential uses of this information to support regulatory activities. Data

SCARC 2015 Presentation Descriptions 3