SLIDE 1 SAROV contribution to tritium washout A number of field experiments were conducted during the project execution to determine the HTO washout with rain. During the rain, a short-term emission of tritium (the duration was up to~ 1 hour) from the point source located at the height of ~30 m was
- implemented. Concurrently, rainwater was collected with samplers located at the distance
- f 150 m from the source. During the experiments, the air temperature, wind velocity and
direction and rain intensity were recorded. The given chapter describes the experimental arrangement, the HTO washout model developed under Project 654; the experimental results are compared to modeling results. During the experiments the following rain characteristics were recorded:
- rain intensity;
- drop distribution in size;
dependence of the falling rate of drops on their diameter
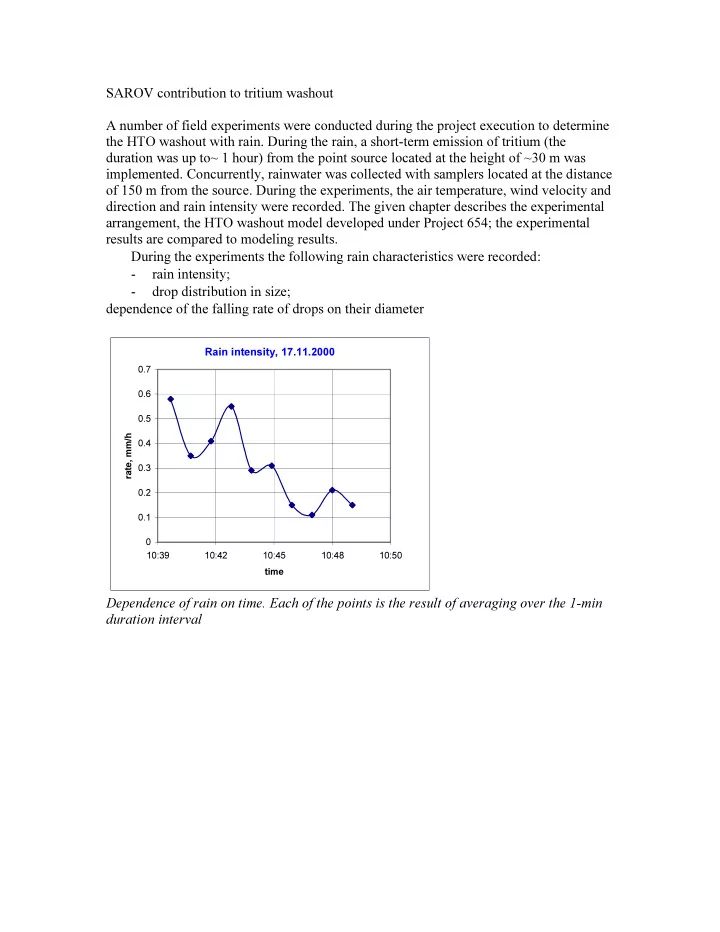
Rain intensity, 17.11.2000
0.1 0.2 0.3 0.4 0.5 0.6 0.7 10:39 10:42 10:45 10:48 10:50 time rate, mm/h
Dependence of rain on time. Each of the points is the result of averaging over the 1-min duration interval
SLIDE 2
10h 40m, R = 0.58 mm/h
1 2 3 4 5 6 7 8 9 0.25 0.5 0.75 1 1.25 1.5 1.75 2 Diameter, mm Velosity, m/sec Rain Theory
Size distribution, 10h 40m, R = 0.58 mm/h 1.0 10.0 100.0 1000.0 10000.0 0.5 1 1.5 2
Diameter, mm
N(D) Rain Theory
Rate dependence of drops on the diameter V(D) and size distribution N(D) [m-3m3mm-1] for the drops within the first interval (1 min. duration). The total number of drops is 459.
SLIDE 3
30 m Uwind x, m z, m d1 d2 d3 d1<d2<d3 2000 m
modeling schema of the raindrop flight through the HTO cloud
Diameter Drop, m
Cdrop / Cair
0.04 0.05 0.06 0.07 0.08 0.09 0.10 0.20 0.30 0.40 0.50 0.60 0.70 0.80 0.90 1.00 9e-5 1e-4 2e-4 3e-4 4e-4 5e-4 6e-4 7e-4 8e-4 9e-4 0.001 0.002 0.003 0.004 0.005 0.006 0.007
Ratio dependence of the HTO concentration in the drop (and in the moisture condensed from the atmosphere at the height of 1 m from the surface) on the drop diameter
SLIDE 4
Comparison of the logarithmically-normal distribution of drops’ volume with the experimental data.
The drops are falling vertically Drop Diameter 0.1 - 6.0 mm (Uwind = 1.2 m/s) Distance, m Cdrop / Cair
0.01 0.10 1.00 100 1000
Normal distribution Best's distribution Log-normal distribution Experiment
The computational dependences of the relative HTO content in precipitations for various functions of size distribution of drops Comparison of the simplest washout model – Сrain=α⋅Catm with the experimental data have shown that the value α=0.4 allows description of averaged experimental data in the best way. At the same time, for the wind velocities of ~3m s-1 the values of this coefficient are 0.35, for velocities of ~ 6 m s-1 it is 0.45 . The washout model developed under the project relates to the average-level- sophistication model. This model accurately describes experimental results. As against the simplest model (α=0.4=const), the developed model yields higher values of the washout coefficient in the vicinity of the source and at long distances away from it.